Saturday, August 6, 2011

Double Dip Or Another Great Depression!


“I did a careful study of the action of the great post-crash rally that occurred during late 1929 into early 1930. The rally was a beauty, stirring up more excitement and volume than did the advances in 1928 to the 1929 top.” - Richard Russell.

You can imagine that market participants during the spectacular advance into April 1930 were convinced that it was resurgence, a revival of the powerful 1921-1929 bull market. Speculators clamored back into the market, thinking it was great opportunity -- they weren’t going to be left standing at the station as the train took off for another great decade of gains.

Truth be told, records shows the economy had actually topped out in late 1928, fading throughout 1929. The market was running on empty. The economy continued to deteriorate as the market roared ahead from late 1929 into April 1930. Just like the market roared ahead into April 2011 as the economy deteriorated?

But then like a bolt out of the blue, the market and the economy came back into correlation and stocks turned down decisively. Just like they turned down decisively in July 2011 as Rosy Scenario divorced Mr. Economy and the fundamental figures could no longer be painted pretty.
With the ending of QE2, the tape could no longer be painted.

With the debt ceiling debate raging, perhaps the funds were no longer easily available for the Plunge Protection Team. Isn’t it special that one day after a debt deal is reached, and funds can be found for The Working Group without the scrutiny of political subterfuge that stocks stage a big reversal? Just happenstance I’m sure. My daddy taught me cynicism well.

Who knows if a double dip will really turn into the Greater Depression. But what is remarkable is that back then the dollar was strong, the US was a creditor nation. Now the dollar and US debt debacle are laughing stocks. Yet most of the jaw jackals, pundits, and financial personalities are sharpening their pencils and ‘calling’ the most likely objective of where the pullback will end and when the next great buying opportunity will arrive.

What if they are all wrong? What if the leg down into the March 2009 low was a big Wave 1, the advance into May 2011 was a big Wave 2, and the stiletto-like angle of attack to the downside since July 2011 is the beginning of a menacing Wave 3?

Few if any are calling for a decline to below 666 S&P. Those that entertain the idea are boys that cry wolf. They are taken serious by few, the financially frail -- those who have fought with and struggled against monster moves in leading names like hyperventilating Faye Rays in the grip of King Kong.

What if?

What if the guns of QE2 are unholstered and the market walks up to Ben Bernanke like Dirty Harry:“I know what you’re thinking. Did he fire six shots or only five? Well, to tell you the truth, in all this excitement I kind of lost track myself. But being as this is a .44 Magnum, the most powerful handgun in the world, and would blow your head clean off, you’ve got to ask yourself one question: do I feel lucky? Well, do ya, punk?”

You feelin’ lucky, Ben?

What if the 4-year or Fibonacci fractal of 1440 degrees from the big top in July 2007 is exerting its influence. What if the pattern of the big spread double bottoms in 2007 that led to a crash when they were broken is repeating here and now with the big double bottoms in 2011 having just broken? Of course, just as the sign of the Bear was flashed in 2008 on the double bottom break, the market backtested the breakdown point. That’s on the monthly charts and the market slid substantially before that backtest played out into May 2008. Be that as it may, a mini-fractal of that pattern could play out now with the S&P backtesting 1260/1264 or even 1280, satisfying a backtest of the broken angle up from March 2009.

What if?

In April 1930, market participants believed the crash was a one-off. They assumed lightening doesn’t strike twice. Sound familiar?

Conclusion:

Tuesday was 90 calendar days from a high which often defines a turning point. As it turned out, Tuesday proved to be a closing low -- for this particular losing streak anyway. On Wednesday the market opened up, implying there was more work to do on the downside. The market proceeded to roll over on top of Tuesday’s flushout with the S&P finally arresting momentum at 1234.

The range from the 1011 low in July 2010 to the 1371 high in May 2011 was 360 points. A Fibonacci .382 retrace of the range is 1234. The closing low so far occurred on August 2nd, 90 days from May 2nd.

However, since 1264 (270 degrees down from high) was broken with authority, the S&P should satisfy a 360 degree move down from the high which equates to 1227. This would accomplish a full backtest of last November’s high (that occurred on November 5th and 1227 ties to November 5th, so these square outs of time and price are worth paying attention to).

Monday, June 20, 2011

Higher USD, End Of QE2 ?


Of late, there's a lot to of discussion about -- Is Quantitative Easing the Last Gasp Bubble?

In any event, and back to the greenback, take a look at the higher low (bullish) in the chart above (below those luscious legs), as well as the fledgling "W" pattern (that will confirm with a move above DXY 76), whichwould also suggest higher prices for dollar proxies. If history repeats, or even rhymes, this should serve as an asset-class headwind.

While I have you, let me say this: I've been asked a lot about what the end of QE2 might mean for the markets. My response is that the purpose of this initiative was to reflate markets such that corporate America could roll their debt and issue stock -- and that's been largely achieved (lets leave the other sides of the debt sandwich -- sovereigns above, consumers below -- out of the conversation for the time being).

That being said, I do believe that the second derivative of the end of QE2 will be a higher dollar, as everyone looks for the light at the end of the tunnel (regardless of whether of not it's affixed to the front of a train). Given the leverage in the system and the correlation of (carry trade) strategies, I do think this will matter, and that's why I've taken so much time to draw your attention to it.

Saturday, June 11, 2011

GOLD, Where Got Bubble?


Any thoughts of a bubble in precious metals is not pertinent at this time. As long as mining stocks are not in favor then any thoughts of a bubble are not applicable in the current situation. Mining stocks should be soaring in tandem with their brothers in bullion. Such is not the case. Miners are trading far below general market valuation. In past history during a bubble, mining stocks soared to hundreds of dollars a share at the same time as bullion.

Wealth in the ground represents an open-ended warrant on mining potential. Mines can grow, new ore bodies can be found, while bullion has no such potential open-ended expansibility.

Gold mining stocks (GDX) are incredibly cheap at $1500 (GLD). Before the credit crisis in March of 2008 as gold hit $1000 an ounce, miners (GDX) hit its all-time high of $55. Now three years later gold is 50% higher, yet the miners have barely been able to break out of the $55 range. Yamana (AUY) and Kinross(KGC) are two majors that have been significantly underperforming gold over the past three years and are not near their pre-credit price levels in 2008. These stocks have not provided any leverage to the price of gold to their shareholders. Investors are sticking to the bullion ETFs and are disinterested in the miners. This lack of interest in this sector signals we still have some way to go in this precious metals bull market.

The gold miners should be trading higher if they kept pace with the rise in the bullion. The standard deviation between miners and gold bullion has never been so great. It is at times such as these that investors can benefit from this apparent discrepancy.

Currently mining stocks have corrected because of apprehension regarding the possible exit from QE2 and growing difficulties for miners worldwide. Investors who were burned during the 2008 credit crisis are concerned about a repetition of such an occurrence and its effect on a potential counter trend rally in the US dollar (UUP) and long-term treasuries (TLT). Small mining companies depend on a readily available line of credit. Investors fear if the flow of capital were to be shut off as had been their experience in the past, their ability to operate might be impaired.

This may represent a buying opportunity for investors in small miners. Miners represent assets in the ground whereas ETFs such as GLD and (SLV) may have a built in weakness in the actual physical gold and silver they are holding. If called upon to produce the actual bullion, they might not be able to do so. This would favor mining stocks which represent actual wealth in the ground.

There may be an implicit weakness in the very nature of a strictly bullion ETF. Simply put, a large quantity of bullion may not be able to be produced on demand. Do not be surprised if the bullion ETFs find themselves unable to meet the demands of the marketplace.

In such cases, the miners would once again come into favor as the investment vehicle of choice. At present there is a deviation between bullion and assets in the ground. Investors may be reluctant to hold paper in such a climate of fear and uncertainty. There are presently astute wealthy investors who have sold some of their bullion to purchase mining stocks.

Again note that many miners are presently languishing while bullion ETFs strut across the financial stage. This anomaly may not last much longer. Presently mining stocks are going through a major fire sale, while bullion commands center stage.

In the markets, it is prudent to expect the unexpected. That is why we should seize the opportunity to buy straw hats in winter. Such an opportunity may be upon us now as bullion ETFs may stumble in the future.

The gold mining ETF GDX may be making a critical turn in the low 50s as it has broken through trend support. The technical conditions are even more oversold than the reversal lows in January 2011, July 2010 and February of 2010. A move above the trendline and moving averages may turn out to be a very powerful buy signal and signal the current correction is over. Careful monitoring of the uptrend is required.

Sunday, May 29, 2011

The 7 Signs.


As a trader who relies on the qualitative art form that is appraising market psychology, I have been collecting some interesting anecdotes and observations from the field. Specifically, traders seem to be ignoring some of the more readily apparent hazard signals the market has been throwing off in the past month.

1. I have repeatedly heard and read to the same effect, "the market is hanging in there, considering...(x y z)." While that is certainly the case broadly speaking, the market has a way of distracting your attention from where it should be focused most. The rampant attention and bipolar swings in investor sentiment surveys appear to be the illusion of choice in declaring the waters safe for the return of risk. I believe there is some utility in knowing where the sentiment vane is pointing over the very short term, however, the market's technical structure typically trumps sentiment (unless it is at a statistical extreme such as in March 2009) over time. If anything, the fact that the market is "hanging in there" on a relative basis could actually portend a more serious underlying condition indicative of distribution. Distribution by institutional participants can create broadening top formations in the indices and erratic sentiment surveys by the swinging price action.

2. A major momentum darling has crashed and burned with silver. Silver's historic decline, coupled with a very shallow bounce, is bearish toward risk returning to the same degree of indiscrimination it represented before it broke down. You could even speculate that the tepid action in stocks like Apple (AAPL) over the past six months was a precursor to the diminishing influence on the risk/momentum continum.

3. The indices all broke their respective 50-day moving averages this week. Friday's action was interesting, considering they were all siting directly beneath them after retracing the break.

4. Ignoring the symmetry and historical context in the two charts below would be Pollyannish at best, irresponsible to risk at worst. Furthermore, knowing what we now know about the developments in Europe and the risks they have going forward -- specifically over the next few weeks in Spain and Greece -- their respective influences to the commodity and equity markets could be strongly reinforcing.

5. The government bond market continues to confuse. The chart above shows the relative disconnect over the past year. This chart should be qualified, in that yields have been in a downtrend relative to the SPX for almost three decades. With that said, the degree of yield erosion relative to the SPX over the past two months should not be ignored or passed off as insignificant.

6. Weekly economic data surveys have taken a turn negative. Whether revealed in the most recent weekly unemployment trends or decelerating GDP, the market is facing an ever more hostile headline risk environment. I typically shy away from incorporating economic data surveys into my short-term calculus because their correlations are erratic at best. But considering the backdrop, it can pay off with timing. Next week will provide the important ISM manufacturing index. Above is a chart of the Empire, Philly & Richmond surveys overlaid on the ISM survey. As the correlations have shown, the already received EPR surveys indicate the ISM will likely be quite weak. The degree of which could be a catalyst (both positive or negative) in the market.

7. The market has respected my monthly meridian chart to the tick. If May continues to follow course away from the meridian at 1363, the June-July months could see an acceleration to the downside.

Overall, I'm skeptical to hanging onto long positions for anything more than a bounce here and feel more comfortable on the short side of the market. That could all change in an instant, and I try to never limit myself from trading the flip side as revealed by my agnostic trading approach.

Wednesday, April 27, 2011

"Tonight's....The... Night...."


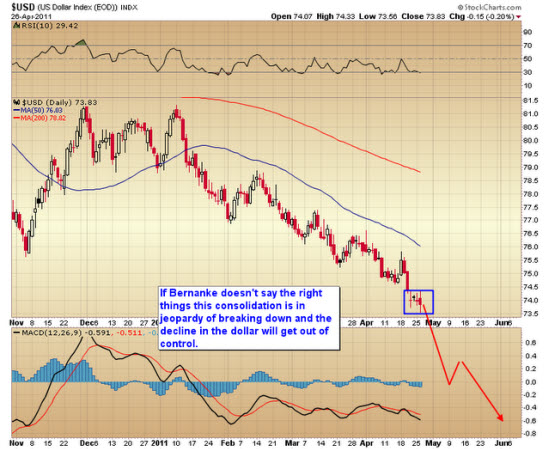
TONIGHT's FOMC meeting and press conference has the potential to either put in a daily cycle bottom in the USD index or initiate a waterfall decline into the dollar's three-year cycle low. There is a lot riding on this meeting.

Let me explain. Today will be the 26th day of the current dollar cycle. That cycle typically lasts about 20-25 days. So it's already starting to stretch here. The last few days the dollar has been consolidating while it waits to hear what the Fed has to say. I suspect if the Fed clearly states it will close down QE2 in June that will give the dollar the impetus for another dead-cat bounce.

Make no mistake though: This will only be a dead-cat bounce. Just because Benny-boy ends QE2 in June doesn't cure the problem of the trillions of dollars he's already printed. The foolish attempt to print prosperity is going to have dire consequences; it is going to cause a dollar crisis. There's no way Bernanke can avoid that now. The damage has already been done. There's no way to push the toothpaste back in the tube!

In the event that the Fed does clearly state their intention to end QE (and I think this is the most likely scenario) the minor dollar rally should drive a continuing correction in gold and silver. They are due for a daily cycle correction. It will only be a correction though. The dollar catastrophe isn't done yet and gold's C-wave still has further to go (a lot further).

The other scenario, and the one I think is less likely, is Bernanke doesn't state a clear intention to halt QE and the dollar tanks, thus initiating a final dollar crisis immediately.

Only a Keynesian academic would think lasting prosperity can be created, with no unintended consequences, by printing money. But it would be crazy to risk sending the dollar over the cliff that it's hanging on. Bernanke had better say the right things tonight or all hell is going to break loose in the currency markets.

Sunday, April 17, 2011

The Impact Of Budget Woes.


Regardless of whether a compromise is reached over the approaching lockdown of the United States ceiling and the raising of the debt, this impasse has momentous significance for holders of gold (SPDR Gold Shares (GLD) and silver (iShares Silver Trust (SLV). The serious weaknesses of the US economic structure is exposing it as a paper tiger. Instead of seeking fiscal sanity, the inability of our leaders to agree on even the smallest of issues is reminiscent of the Roman Empire dealing out bread and circus to the masses when Rome could no longer afford the good times and the games.

Let’s look at their pathetic reality. US legislators are unable to come up with as little as 2% of a total budget measured in the trillions. While the Republicans and the Democrats are separated by only several billions, the underlying issues are ignored. This may be because they are witnessing political theater in a dress rehearsal for the 2012 election. The actual battlefields on which both sides face one another are not only fiscal, but ideological as the debate raged over Planned Parenthood funding. The media in their attempt to sell newspapers and program time sensationalize the basic issues. Simply put, the US is approaching insolvency. Their ship of state is sailing straight into a sea of icebergs. Sooner or later they will have to come to grips with the urgent reality that belts will have to be tightened. If they do not sober up to the reality of our situation, the decision to keep her national vessel afloat will occur whether they like it or not.

Remember that they have to borrow forty-three cents out of every dollar that thet use to pay for their expenses. To put it succinctly, 50% of the US population pays no taxes. The revenues to pay their national debts are coming off of the hides of the middle class, the wage earners and the small businesses. It is somewhat peculiar that the basic truths for their survival are not mentioned. Do not be diverted by the ambient noise that tends to complicate the issue. They have been sidetracked by irrelevant issues; they are spending themselves into a financial quagmire. This is hurting the hard-working middle class who are dealing with a deteriorating US dollar (PowerShares DB US Dollar Index Bullish (UPP) and simultaneously carrying the load of increased tax burdens. Also long-term yields are rising and institutional investors are selling their US debt holdings raising long-term yields.

It would all be worthy of a Fellini farce if it weren't so sad. The situation cries out for solutions I've proposed in the heat of the financial meltdown, concentrating on precious metals and key natural resource stocks to hedge against a dollar devaluation and burgeoning debts.

What goes completely unmentioned is the role of the Fed in the entire equation. The Federal Reserve Bank is the one factor in this equation that has the unquestioned, uncontrolled power to change unexpectedly the best laid plans. The Fed is omnipresent, omniscient and omnipotent. All this time it watches and waits. One change in the Fed discount rate, one raise in margin, one change in the direction of interest rates and quantitative easing by the Imperial Fed can rewrite the whole script. They are accountable to no one and answer to no one. They can and have, if needed, print fiat money and cheap paper to obfuscate growing budget deficits. All eyes are on QE ending in June and what will occur with long-term interest rates. As the act continues in Washington, as the Democrats and Republicans try to show the masses who is more fiscally prudent, the reality is that the Fed will have to continue printing cheap dollars to pay off huge debts. Investors realize this and that is why I am seeing these major moves in gold.

Let us keep a firm hand on the wheel and steer a sound course with the compass tuned to the North Star of our technical discipline. It is important to remember that the charts give us clues during this treacherous times and allows us to go where the smart money is moving.

We are living in extremely volatile times and the market will play on our mind and emotions. That is why it is crucial that we become stronger than the average investor who easily gets caught up with the herd mentality. These amateur investors get aggressive at overbought levels and dump their positions during sell-offs. Remember when you invest in anything you become subject to inner feelings of anxiety and greed. You need to realize that a technical system protects you from becoming subject to the dangerous, contagious emotions of the investment community. I have unfortunately learned that what takes you months to earn can be taken from you in a matter of days.

The gold silver:ratio has dramatically favored silver since I wrote that. Silver is extremely volatile and has often in the past exceeded its measured targets. It is much less reliable for timing purposes than gold and could easily overshoot my late January $40 target. The US dollar is heading into new lows without showing any sort of dead cat bounce, which is quite concerning. Investors have flocked to the Euro (CurrencyShares Euro Trust (FXC)) which is quite dangerous for some countries paying back huge debt burdens and for countries who rely on exporting overseas. Do not be surprised if we see some economic weakness resurfacing in the eurozone.


Thursday, April 7, 2011

Yen Carry Trade May Return.


Japan had lost the race to the bottom against the US. " Ben, Ben, he’s our man / if he can’t print ‘em / no one can! "

As the risk of yen revaluation in deflationary Japan exceeded the risk of dollar inflation in the US -- where the Fed declared its intentions to have inflation rise and then abjured responsibility for inflation when it did rise and as Japan’s customers were forced into “must-do” trades for buying the YEN to pay their Japanese suppliers -- why would anyone take the risk of borrowing the yen when they could borrow the dollar instead?

Now the US is faced with the situation where the G-7 central banks have arrested the upward spike in the yen threatened after the country’s disasters and affirmed the old highs just under 80 as resistance. The net result of this move is a global borrower can now borrow the yen without fear of further revaluation!

The Dollar Carry Into the Yen

If we turn the trade around and look at the two components of the dollar carry into the yen, the interest rates spread and the spot rate return, we can see just how meaningless the interest rate component has been since the US went to a zero interest rate policy in December 2008. The spot rate return on borrowing the dollar and lending the yen has moved higher as Japan has been unable to break away from its deflationary miasma while the Federal Reserve has convinced investors the US will, one day, defeat the deflation that never existed.

Reviving the Yen Carry Trade

If the US does adopt an exit strategy from QE2 and the dollar becomes more expensive to borrow while the yen is not at risk of running away to the upside, the wider interest rate gap between the US and Japan will make Japan the preferred funding source once again. As noted last November, this has not been the case since the financial crisis; we can match the carry return of the dollar into a basket of emerging market currencies quite closely, but the yen carry trade has been irrelevant.

Where does this lead? If the dollar carry seized the baton from the yen carry trade and allowed all manner of emerging market assets to shoot higher in 2009 and most of 2010, then the yen carry trade can return the favor and finance the US should the Federal Reserve adopt an exit strategy. US would tighten; they would un-tighten for the US.

That would be quite bullish for US financial assets should events unfold this way.