Wednesday, December 29, 2010

A Sneak Peek into 2011's Crystal-Ball.


It's almost impossible to find anyone who's long-term bearish on the stock market or economy at this time. In the recent Barron’s poll, every single analyst expected a rise in stock prices next year and continued economic expansion.

I think they're all going to be wrong, horribly wrong.- The Chinese say : "droping one's specticles." I believe next year the stock market will begin the third leg down in the secular bear market. And the global economy will tip over into the next recession that will be much worse than the last one.

I've gone over the three-year cycle in the dollar index many times. The dip down into the next three-year cycle low this spring should drive the final leg up in gold’s massive C-wave. What I haven't talked much about is what happens after the dollar bottoms.

I actually expect this three-year cycle in the dollar to play out almost exactly like it did during the last three-year cycle. When the dollar collapses this spring it will not only drive the price of gold to a final C-wave top, it will drive virtually all commodity prices through the roof, the most important being energy and to some extent food.

It was the sudden massive spike in energy that drove the global economy over the edge into recession in late 2007 and early 2008. The implosion of the credit markets just exacerbated the problem. You can see on the above chart that just as soon as Ben Bernanke drove the dollar below long-term historical support (80), oil took off on its parabolic move to $147.

What followed was a collapse in economic activity and the beginning of the second leg down in the long-term secular bear market for stocks.

This was mirrored by the dollar rallying out of the three-year cycle low. That rally was driven by the severe, but brief, deflationary pressures released as the global economy and then credit markets collapsed.

We'll see the same thing happen again. In his attempt to print prosperity and reflate asset prices, Bernanke is going to spike inflation horribly as the dollar collapses down into the three-year cycle low next spring. Just like in 2008, that will tip the global economy back into recession and another deflationary period as the dollar rallies out of the three-year cycle low.

The stock market will begin the trip down into the next leg of the secular bear market that it's been in since 2000. The global economy will roll over into the next recession, which I expect to be much worse than the one we just suffered, though mainly because it will begin with unemployment already at very high levels.

Contrary to what economists and analyst are saying, at the dollar's three-year cycle low next year it will be time to put our bear hats back on and prepare for hard times and the next leg down in the stock market bear.

Wednesday, December 8, 2010

Good Times Ahead for Gold..AGAIN!


One of my favorite form of technical analysis: intermarket analysis. Intermarket analysis takes traditional technical analysis much further. Normally, I would look at a market by itself. I'll look at its price action, its potential patterns, and its momentum. Intermarket analysis takes this a step beyond by comparing the market at hand to various other markets. It gives us an idea of what is really going on and where market leadership is.

In regards to gold, intermarket analysis is even more important. Gold is the type of market or asset that thrives when other asset classes are not performing well. Rarely does gold perform well if there is persistent strength in another asset class such as stocks or bonds. We are in a gold bull market, so gold will outperform other asset classes over time. However, it is an important exercise in trying to gauge the near-term outlook for the yellow metal.

Above, I graphed gold against the various asset classes: commodities, bonds and stocks. And also graphed gold against currencies, as it is the currency of last resort.

We can see that gold has already broken out against both corporate and Treasury bonds. The breakout against corporates is very significant as it comes after a two-year base. Meanwhile, gold has just broken out against currencies (ex: US dollar) and a breakout against stocks appears imminent. Commodities are the only group holding up against gold.

The conclusion: In the near future, money will move out of Treasuries, corporates, currencies, and stocks and go into gold and likely commodities. The last time gold looked this strong in relative terms was in the third quarter of 2009 when it began a move to $1,220/oz. With this type of relative strength, it is very likely that gold makes another big move into 2011.

Saturday, December 4, 2010

Europe Driving Interest US Rates Higher?


Interest rates, across the board, have actually been spiking since the announcement of the QE2 program on November 3. Not to anyone surprise, the Fed was more or less powerless to lower rates from prevailing levels. I argued that QE2 was really not designed to drive rates down from prevailing levels but merely to “accommodate” the fiscal deficit and prevent a rise in rates that would otherwise occur due to crowding out and other effects.

The bottom line was that the real risk was that interest rates throughout the US economy would rise after the announcement of QE2. Indeed, I believe that the US is currently in a situation anticipated in QE2 May Not Prevent a Rout in US Bond Markets, in which I asked: “How much panic would it create if quantitative easing (QE2) is announced, the Fed starts purchasing Treasuries, and bond yields actually start to rise?”

10-Year US Treasury yields (TNX) have risen almost 60 basis points since the announcement of QE2, municipal bond yields have spiked, corporate bond yields have risen, and mortgage rates have spiked. Indeed, overall, interest rates across the board are actually higher than they were before financial markets began to discount the prospect of QE2.

Having said that, it's important to note that although rates have risen, they are still well below levels that could jeopardize the economic recovery. The question is what happens next.

In the short term, a few issues need to be monitored. For starters, investors should be aware of the fact that the crisis in Europe is actually “bailing out” the US in some sense. In the global competition for capital, troubles in Europe make the US seem like a relative safe haven thereby facilitating the financing of the US fiscal deficit. Furthermore, troubles in Europe will tend to depress global growth expectations and ease fears of commodity-driven inflation. Thus, the situation in Europe will be a key driver in US interest rate dynamics.

Second, any whiff of accelerating inflation in the US could have a dramatic impact on the bond markets. Again, developments in global commodities markets are key in this regard.

Finally, at some point, investor scrutiny is going to be turned toward congressional and presidential action with respect to the US fiscal deficit and sovereign debt fundamentals. Today’s news of the failure of the presidential deficit commission to garner the necessary votes to issue an official recommendation is a worrisome development in this regard.

Conclusion

US interest rates are supposed to be falling, not rising. At least that's what we were led to believe a few months ago when market consensus was excited about QE2 and the Fed’s power to stimulate the economy.

It's now becoming clear what I had been emphasizing prior to the implementation of QE2: The Fed is not really in control of US interest rates.

This sense that the Fed has lost control of interest rate dynamics could add an important element of uncertainty into financial markets in the coming months.

This is particularly important in a context in which investors generally are over-exposed to bonds.

A long bear market in US bonds has probably already begun. Bad news out of Europe is probably the only factor that will be able to sporadically arrest the upward assent of US interest rates in the coming weeks and months.

I believe that US bond rallies due to instability in Europe should be utilized to initiate short positions in various categories of US bonds.

Tuesday, November 30, 2010

PIIGS Crisis Is Benefiting Japan.


Marc Faber's "bowl of liquidity" analogy, showed us how as a result of the European sovereign debt crisis, money could flow out of PIIGS debt and into equities. I wanted to provide a little more color given the events of the past couple weeks as the crisis has moved from Ireland and Portugal to Spain and Italy.

In the chart above, tells a different story. Here, the Euro Stoxx chart is in orange, the S&P 500 is in white, and the Nikkei is in green. And we see that since the Spain/Germany spread bottomed on October 26, the Euro Stoxx is down 6.5%, the S&P 500 is up 0.2%, and the Nikkei is up a whopping 8.0%! Whoa, what's going on?

What I believe to be happening is that with the current crisis being one more of solvency than liquidity (though Spain may have something to say about that), instead of markets being simply "risk on" or "risk off," idiosyncratic factors are coming into play as global asset allocators evaluate their options. Due to the PIIGS crisis, borrowing costs are rising for the European sovereign market -- yesterday was scary because not only did Spanish 10-year yields rise 25bps, but German 10-year yields also rose -- which feeds back into the private market for European borrowers in the form of more expensive credit. Austerity measures impact growth prospects. And allocators, aware of this, are moving money out of Europe -- not just sovereign debt but equities as well. European-focused funds may be experiencing redemptions, and oftentimes portfolio managers are forced to sell their most valuable assets that still have liquidity (equities) instead of the distressed ones they'd like to unload (sovereign debt). And this money is finding its way not just into real safe havens like US, German, and Japanese debt, but the US and Japanese equity markets as well. After being neglected for so long by investors, the smallest trickle of inflows into the Japanese equity market could create a surge along the likes of the commodities market in the earlier part of the last decade.

This is not to say that it's time to load the boat with Japanese and US equities. The crisis has still not passed. If Spain or Italy seizes up it could do untold damage to all asset markets with the liquidity crisis returning for awhile. But I believe that correlations are breaking down as the crisis shifts from one of liquidity to one of solvency, and when solvency crises intermittently create liquidity crises it's time for investors to think about what to own while assets with true value are being treated no differently than ones that truly might go to zero.

Sunday, November 21, 2010

The Fed Could Be Wrong This Time.


Every precious metals investor should be concerned about China, one of the world's fastest growing economies, raising its rates and rising yields. Changes in the rates affect stock prices. China is leading the world and we can see the fears are profound as sell-offs this week were much stronger than any of the relief rallies. If China’s market corrects then the commodity market, which was fueling the equity market, could experience a severe correction. It's a domino effect.

Despite the Fed’s enthusiastic plan to monetize debt and artificially keep interest rates low through bond purchases, yields have risen aggressively for the last 13 weeks. The QE2 program was designed to lower interest rates to improve borrowing and liquidity. Instead the opposite occurred, QE2 is initiating higher borrowing costs. I don’t believe it is coincidence that Ireland’s debt problems surfaced following QE2. China is now on the verge of raising rates to combat imported cheap dollars to bid up Chinese assets, which is putting pressure on markets globally. Rising rates kills equity and commodity markets, which are heavily built on margin borrowing.

The Long Term Treasury ETF (TLT) (above)broke through the trend it had from May until the end of August. This previous trend was largely a result of a deflationary crisis where investors ran from risky assets like the euro to the dollar, and long-term Treasuries were pushing yields to ridiculously low levels. As fear in the markets decreased, due to a temporary stabilization in Europe and the US, investors ran to equities and commodities.

International reaction to QE2 has not been positive. There is an increased risk of emerging markets combating inflation, which may slow down the global recovery. Fears of China and emerging markets raising rates make investors unsure where to turn.

Asset classes have reacted negatively to China’s expected move. Distribution is apparent through many sectors and many international markets. Rising interest rates have a direct influence on corporate profits and prices of commodities and equities.

When studying interest rates it's not the level that is important, it's the rate of change. Interest rates have had a dramatic increase these past two months and we may see that affecting the fundamentals in the economy shortly.

The recent downgrade on US debt from China, signals demand for US debt has been waning. This rise in interest rates puts further pressure on the recovery as the cost of borrowing increases. Economic conditions are worsening in Europe and emerging markets in reaction to quantitative easing and imported inflation. Concerns of sovereign debt issues are weighing in Europe. As yields rise so do defaults and margin calls.

If the 200-day is unable to hold the bond decline and continue to collapse, then rising interest rates could negatively affect the economic recovery. Borrowing costs to insure government debt are reaching record levels internationally. Ireland is expected to take a bailout. Greece, Spain, and Portugal are in danger as well.

Commodities have significantly moved higher along with the equity market for September and October as investors left Treasuries to return to risky assets due to the fear of debt monetization through QE2. Global equity markets have been rising. But the question is, how long? This makes investors reluctant to take on debt, which is the exact opposite of what the Fed’s goals were. Rising yields could lead to a liquidity trap and deflationary pressures.

Tuesday, November 16, 2010

Bubbles, Signs.. And All Things Nice!


What other bubbles are lurking out there in the global economy?

1. Gold: The price of gold bullion has risen from $294 an ounce in 1998 to $1,404 last week, an increase of 377%. "It's the biggest, baddest bubble of them all," says Robert Wiedemer, author of Aftershock: Protect Yourself and Profit in the Next Global Financial Meltdown. Gold has no intrinsic value. A telltale indicator that gold is a bubble: incessant cocktail party chatter about buying gold and endless investment banks offering to sell gold derivatives. The SPDR Gold Trust ETF (look to your left) is up 28% since the beginning of the year.

2. Real estate in China: Chinese real estate prices are up only 9.1% this year, which may seem more frothy than bubbly. But rising prices are generating rising demand, which is a clear sign of a bubble, says Vikram Mansharamani, whose book, Boombustology: Spotting Financial Bubbles Before They Burst, will be published early next year. The participation of amateur investors like waiters and maids in the property boom is a clear sign of a property bubble in China. The fact that developers are building more apartments than there are buyers is another giveaway.

3. Alternative energy: Solar technology is still uneconomic, yet governments all over the world are subsidizing solar energy firms. "There are plenty of people who shouldn't be in the solar energy industry who are," says Mansharamani. Do we really need 250 venture-capital-backed solar cell companies? The Market Sectors Solar Energy ETF had a 100% gain this year, before dropping back.

4. Commodities: Blame it on the weather, China or the dollar or the Fed, but commodities have shot higher in recent months. Wheat is up 60% this year, and other food commodities like corn have also risen dramatically. "The focus is on the food category for bubbles," says Wiedemer, but industrial metals like copper are also very frothy.

5. Emerging market stocks: As an asset class, these shares have risen 146% in the past two years. "We're only halfway along the way to a gigantic eventual bubble in the emerging markets," says Barton Biggs, the former Morgan Stanley Asset Management chairman who accurately predicted the US stock market bubble in the late 1990s. These countries, such as Indonesia, Australia, Russia and Brazil, are growing wildly even though there's no growth in the world economy. Much of their gains is backed by commodity prices, which are also a bubble (see item No. 4). "I have every reason to believe this will turn into a bubble," says Mansharamani.

6. The US dollar: Although the dollar is down 10% against the euro so far this year, Wiedemer believes the greenback is firmly in bubble territory. He believes it will pop when foreigners stop buying US assets such as stocks and bonds. "Foreigners say, 'I'm worried about inflation -- you're going to pay me back in dollars worth less than when I invested'." While China may hold its dollar bonds forever, he says, pension funds in Japan and insurance companies in Europe will start dumping dollars as US inflation climbs.

7. US government debt: "When this bubble pops you're out of bubbles -- nothing is too big to fail any more," says Wiedemer. The debt bubble is growing very rapidly and will continue to grow, he says. Basically, there's no way the US government can ever pay back the $13.7 trillion it currently owes (mainly to foreigners), and eventually they will stop buying. The bubble pops when the government has trouble selling its debt -- just like Ireland and Greece are experiencing at the moment. Instead of borrowing money, the government starts printing money, which is what's happening now. The Fed's balance sheet has gone from $800 billion in 2008 to $2.2 trillion, and the central bank just announced it was printing another $600 billion. Says Wiedemer: "The medicine starts to become poison." - All these, just when bewildered, lost uncles and aunties are learning from your local research houses' market outlook roadshows about what's QE2!

Saturday, November 6, 2010

USD, The Confetti In Wallets After QE 2.


Forget about fundamentals or technicals: just follow the bouncing buck.

Strategists emphasize that a new theme has emerged in the investment markets, which is that the risk-on/risk-off trade is taking its cue increasingly from the US dollar. The correlations, market pros say, are high, intensifying, and actually now unprecedented.

For example, according to Gluskin Sheff’s David Rosenberg, over the past two months, 90% of the time that the dollar moved in one direction, the S&P 500 moved in the other. The inverse correlation, over the same time period between the dollar and emerging market equities, was 92%; it’s now running at 95% for the CRB index.

Interesting positive correlations are also now firming dramatically. For instance, over the past two months, the dollar and corporate spreads moved in the same direction 80% of the time. The dollar and the VIX, which tracks expected volatility in the stock market, moved in the same direction 80% of the time.

In other words, ignore the politics, economic data and technical levels. Maybe right now all money-making traders and investors need to do is follow the dollar. It’s a simple tune whistling through the canyons of lower Manhattan: dollar down, everything else up.

“Hard to believe it’s that easy, but this seems to be the environment that Ben Bernanke have managed to create in their quest to reflate the global economy,” Rosenberg says.

Historically, say strategists, these correlations weren’t this pronounced, but that changed when the Federal Reserve began buying Treasury securities. Last week, the Fed announced that it will print another $600 billion to buy Treasuries through mid-2011. That’s in addition to the roughly $2 trillion it printed to buy Treasuries and mortgage debt during the financial crisis.

The point of the program is to keep long term interest rates low, encouraging borrowing and spending by consumers and companies. The idea, if Bernanke and his FOMC allies are right, is that yields will tumble and people will start buying homes again. Expecting greater inflation ahead, they’ll also buy more stuff at the mall. In turn, companies can start hiring and unemployment will fall.

Of course, investors also know that vastly increasing the supply of dollars means each dollar is worth less when measured against other things. So they’re concerned about the real worth of all that confetti in their wallets, and they’re looking to protect themselves by diversifying into other assets.

Since August 27, when Bernanke suggested that another round of monetary stimulus was on the way, the dollar index (DXY), a measure of the dollar against a basket of currencies, is down 8.4% Gold was up 12.5%.

“This is part of the same trade we’ve seen since March 18, 2009 when Bernanke said he was going to start buying Treasuries,” says Miller Tabak’s Peter Boockvar, as investors look to protect themselves from a lower dollar by loading up on the stocks of big exporters, emerging market equities, hard assets, and foreign currencies. “Maybe now it’s just intensified,” he says.

Critically, says S&P’s Alec Young, the point isn’t just that the Fed is printing another $600 billion, but that central bankers also left the door open to keep printing more money if necessary.

“That was a green light for the risk trade,” he says. “It means an open-ended amount of dollar printing. So the dollar is tanking and commodities, gold, bonds and stocks go up. It reinforces all those trades.”

At some point a few months from now, Young says, investors will want to see real evidence that all this monetary experimentation worked. If they don’t see the economic benefits then they could sell stocks and commodities in anticipation of another leg down. But, for now, he argues, it’s unwise to violate the first rule of Investing 101: Don’t fight the Fed.

“There could be a correction next year when people are disappointed at what this actually accomplished,” Young says. “But that’s the next trade. Right now, the Fed gets the benefit of the doubt. You could be right and all this won’t do any economic good but, in the meantime, you could also miss out on the rally.”

But, if the risk-on/risk-off trade is taking its cue increasingly from the U.S. dollar, when might that relationship fade?

That happens, says Young, when we generate a stable, self-sustaining recovery. “It breaks when the U.S. economy finally gets on its feet and doesn’t need the Fed to keep printing a ton of money,” he says. “If QE2 works then that marks some kind of bottom for the dollar.”

Sunday, October 31, 2010

The Dollar Correlation Myth.


Last Friday, is year-end for many funds. Monday they can "legally" sell.

Monday also begins the first week of November when the three-week bias we mentioned at the beginning of the month culminates. While the market has held up into month-end, fiscal-year end, it hasn't blown off. It’s been choppy and mixed with earnings providing more than the usual Gapism.

Once again, Friday’s early strength was faded but longs came in with a late-day buy program to rescue the session as the S&P was magnetized to the pivotal point of 1184 on the close. Remember 1184 is opposite the time of the late August low and squares the important January high to open the year as it's 90 degrees from that price high of 1150. It's also roughly 90 degrees from the 1220 April high, which is by definition then opposite the end of October.

These squares may be playing out in a six-month top-to-top cycle.

In addition, 1184 is opposite 1115, which is the midpoint of this year’s range.

The March ’09 S&P low at 666 was a 75-point "undercut" of the November 21 low of 741. A 75-point "overthrow" of the midpoint or balance point of the year is 1190. The S&P has been oscillating around 1180 to 1190 all week.

Previous Friday’s close was 1183. Last Friday’s close was 1184.

If gold itself doesn’t start back up strongly by Monday, it suggests it will pullback for another three weeks or so possibly testing the 1230ish level.

The dollar seems to dictate the direction of everything lately. But is this inverse correlation to a declining dollar and rising equity prices overcrowded? Is the notion even true? Does the notion of the dollar devaluation/asset inflation trade always hold true to form?

Let’s look at a weekly chart (above) of the dollar from 2008 versus a weekly chart of the S&P from 2008.

The dollar declined into March/April 2008 in concert with stocks (A).

Notable is the marginal overthrow by the dollar in the first week in March 2009 that marked the precise low tick in stocks. The high tick in the dollar corresponded to the low tick in the S&P (D).

The November 2009 low in the dollar preceded the January high in stocks (E).

Note that the April high in stocks (F) didn't coincide with a top in the dollar. The dollar continued higher to challenge the 2008/2009 highs. The dollar/stocks correlation broke down April to June as the euro got smashed. There were other concerns. "Other" concerns could cause an unwinding again. It is interesting that the decoupling in question this past spring covered the period when the flash crash occurred. Happenstance?

From point E to point F the stocks and dollar advance is positively correlated. Both rose in unison. However, the dollar accelerated strongly in April as stocks topped and declined. Both the dollar and stocks topped in unison (G) in April and declined into the summer.

From the summer into October this year the dollar turned down again while stocks turned decidedly higher: The inverse correlation resumed.

While the market has essentially advanced from March 2009, the dollar has made two round trips.

The tip-off that March 2009 was a low in stocks was the marginal overthrow by the dollar that month over the prior swing high at 88.46 and the outside down week in March 2009.

If there's anything I've learned in my trading career it's that correlations come and correlations go and when they become too popular, they can get unwound violently.

It may be that the inverse correlation resumes here with the dollar staging a rally and stocks going lower, but they could just as easily go their separate ways.

With the election, FOMC, and G-20 in November where leaders will tackle the race to debase their respective currencies, volatility could explode.

Moreover, it's the two-year anniversary of the November 2008 crash low. We got a spring 2009 undercut of the November 2008 spike low. Is it possible we're getting a November spike high to a spring pivot in 2010.

Checking the weekly chart of the S&P and drawing a live angle up from the "true" low of November 2008 and tagging the important July 2009 low shows what may be a bearish backtest. In other words, following the break of this live angle in the summer, the S&P has snapped back to kiss the underbelly of this angle. However, the first "kiss" was rejected in early August while the jury is still out on the second "kiss." Will the second "kiss" get the cheese or the prize?

This may be at the mother of all inflection points. Either the market could extend from here substantially in time and price or it's headed meaningfully lower. And by substantially higher, as you know, I'm not referring to the possibility of a tag and inverse head-and-shoulders projection to 1250 S&P being satisfied going into January. This could play out and still be an overthrow of this live angle. Substantial, in this case, refers to a revisit of the prior all-time highs. This period here in November and then again in January will give us indications as to which way the pendulum will swing.

Thursday, October 28, 2010

Money Flowing Into GOLD.


Since the financial crisis in 2008, it's undeniable that precious metals have been the best performer. One would assume that market participants have been piling into precious metals. Certainly some money has moved into the sector, smartly anticipating the continuance of a major bull market and looming severe inflation in the next several years. Yet, most funds have moved into fixed income.

Corporate bonds have been an even better performer than treasuries and rightly so. Not now, but a year or two years ago one could find great yield with the bonds of blue-chip companies, which will be in business for the years to come. Meanwhile, Uncle Sam has taken on the losses of the private sector amid a worsening economy. To begin with, Uncle Sam's balance sheet was a mess.

How does this all relate to gold? Another way to track fund flows is to compare markets via intermarket analysis. Gold has performed very well but most money has moved into fixed income. Gold will begin to accelerate when money starts moving out of bonds and into gold. The chart above shows gold versus the total return of corporate bonds.

This ratio just broke out from a 31-month base! Since the crisis, gold and corporate bonds were performing about equally. Now gold has gained the upper hand. This breakout could be the start of a new trend in fund flows over the next several years. Look for money to favor gold and other commodities, as inflation becomes a major concern. Ignore those who are promoting stocks as a way of beating inflation. Their interests aren't aligned with yours.

How does this affect gold right now? Gold is in a correction. I have upside targets of $1450-$1500 with a downside target of $1280-$1290. No one can predict the future but we can assess probabilities and manage risk. If this breakout holds then it means money in fixed income is starting to worry about inflation. After all, the above chart is providing an early indication. Ship'it out shagg !

Saturday, October 23, 2010

The Recent Surge In Indonesia And Malaysia ETFs.


The Market Vectors Indonesia ETF is up 40% year to date while the iShares MSCI Malaysia Index Fund is up 30% over the same time frame.

For anyone that follows emerging markets ETFs, this won't come as a surprise, but inflows to funds tracking Indonesia and Malaysia have surged this year.

BlackRock, parent company of iShares, the largest ETF issuer in the world, said inflows to Indonesia ETFs have more than doubled to $469.2 million through the first nine months of this year compared to $167.5 million for all of 2009.

Malaysian ETFs have garnered $346.1 million in new investments, compared with $71.1 million in 2009.

Specifically, IDX has attracted $340 million in new cash this year and the iShares MSCI Indonesia Investable Market Index Fund (EIDO) has landed more than $200 million assets and that fund made its debut less than six months ago.

EWM has landed $268 million in new cash through the first nine months of 2010.

The inflows may not be stopping, either.

Indonesia's stock market is forecast to see annual earnings growth of 18.5% in 2010 rising to 21.5% next year, according to Citigroup, while Malaysian earnings are projected to increase 24.9% this year before slowing to 12.9% in 2011, according to the Financial Times.

Sunday, October 17, 2010

Wat Ben Said, and Wat It All Means For The Markets.


Ben: "The near-term pace of recovery to be 'fairly modest'."
Translation: Despite the first trillion dollars, the disconnect between the stock market and the economy persists.

Ben: "2011 growth is unlikely to be much above long-term trend."
Translation: Even with historic stimuli, we'll be lucky to get back to what was previously considered a normal recovery.

Ben: "Measures of underlying inflation are 'trending downward'."
Translation: We don't wanna say "deflation" -- it’s an admission of defeat -- so we'll dance around the topic and vaguely allude to it.

Ben: "Fed is ready to provide more accommodation if needed."
Translation: Engine room, more steam! We'll print moew money.

Ben: "Bulk of increase in unemployment is due to contraction."
Translation: Hey, it wasn't me!

Ben: "Inflation trends will be subdued for some time."
Translation: It's gonna be a long hard road.

Ben: "Pace of growth is less vigorous than we would like."
Translation: What’s the definition of hyper-inflation? Spend one trillion dollars while running to stand still.

Ben: "Labor market recovery is 'painfully slow'."
Translation: The velocity of money was critically damaged with the collapse of Fannie Mae and Freddie Mac.We are screwed!

Ben: "Risk of deflation is higher than desirable."
Translation: DAMN! Who let that word slip through the censors?

Ben: "Fed has less experience on the impact of asset purchases."
Translation: Your guess is as good as ours!

Ben: "FOMC will be able to tighten policy 'when warranted'."
Translation: Sorta like a slow pick-off toss to first base; you won't catch the runner, you just wanna keep him honest.

Ben: "See a case for 'further action' with too low inflation."
Translation: Don't push me 'cause I'm close to the... button.

Ben: "Fed could buy assets."
Translation: A classic case of post-rationalization but now I said it, so there!

Saturday, October 9, 2010

The Light At The End Of The Tunnel, Is An Oncoming Train!


Peak Oil, sovereign insolvency, and currency debasement will permanently transform the economic landscape.

The US isn't yet on the final path to recovery, and there are one or more financial "breaks" coming. Underlying structural weaknesses haven't been resolved, and the kick-the-can-down-the-road plan is going to encounter a hard wall in the not-too-distant future. When the next moment of discontinuity finally arrives, events will unfold much more rapidly than most people expect.

I am figuring out which macro trends are in play and then helping people adjust accordingly. Based on trends in fiscal and monetary policy, I favoured accumulation of gold and silver in 2007. These weren't "great" calls; they were simply spotting trends in play, one beginning and one certain to end, and then taking appropriate actions based on those trends.

We happen to live in a non-linear world, a core concept of the Crash Course. But far too many people expect events to unfold in a more or less orderly manner, with plenty of time to adjust along the way. In other words, linearly. The world doesn't always cooperate, and my concern rests on the observation that the world economy still face the convergence of multiple trends, each of which alone has the power to permanently transform our economic landscape and standards of living.

Three such trends (out of the many I track) that will shape our immediate future are:

-Peak Oil
-Sovereign Insolvency
-Currency Debasement

Individually, these worry me quite a bit; collectively, they have my full attention.

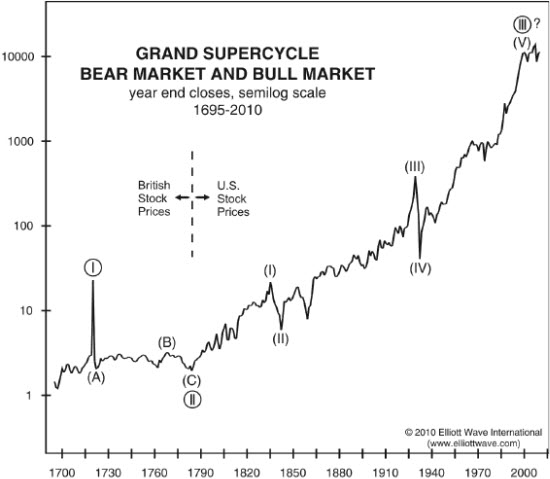
History suggests that instead of a nice smooth line heading either up or down, markets have a pronounced habit of jolting rather suddenly into a new orbit, either higher or lower. Social moods are steady for long periods, and then they shift. This is what we should train ourselves to expect.

No smooth lines between points A and B; instead, long periods of quiet, followed by short bursts of reformation and volatility. Periods of market equilibrium, followed by Minsky moments. In the language of the evolutionary biologist Stephen Jay Gould, we live in a system governed by the rules of "punctuated equilibrium."

Accepting "What Is"

The most important part of this story is getting our minds to accept reality without our passionate beliefs interfering. By "beliefs" I mean statements like these:

“Things always get better and are never as bad as they seem.”

“If Peak Oil were ‘real,’ I'd be hearing about it from my trusted sources.”

“Dwelling on the negative is self-fulfilling.”

Peak Oil

Peak Oil is now a matter of open inquiry and debate at the highest levels of industry and government. Recent reports by Lloyd's of London, the US Department of Defense, the UK industry taskforce on Peak Oil, Honda (HMC), and the German military are evidence of this. But when I say “debate,” I'm not referring to disagreement over whether or not Peak Oil is real, only when it will finally arrive. The emerging consensus is that oil demand will outstrip supplies “soon,” within the next five years and maybe as soon as two. So the correct questions are no longer, "Is Peak Oil real?" and "Are governments aware?” but instead, "When will demand outstrip supply?" and “What implications does this have for me?”

It doesn't really matter when the actual peak arrives; we can leave that to the ivory-tower types and those with a bent for analytical precision. What matters is when we hit “peak exports.” My expectation is that once it becomes fashionable among nation-states to finally admit that Peak Oil is real and here to stay, one or more exporters will withhold some or all of their product "for future generations" or some other rationale (such as, "get a higher price"), which will rather suddenly create a price spiral the likes of which we haven't yet seen.

What matters is an equal mixture of actual oil availability and market perception. As soon as the scarcity meme gets going, things will change very rapidly.

In short, it's time to accept that Peak Oil is real -- and plan accordingly.

Sovereign Insolvency

Once we accept the imminent arrival of Peak Oil, then the issue of sovereign insolvency jumps into the limelight. Why? Because the hopes and dreams of the architects of the financial rescue entirely rest upon the assumption that economic growth will resume. Without additional supplies of oil, such growth won't be possible; in fact, we’ll be doing really, really well if we can prevent the economy from backsliding.

Virtually every single OECD country, due to outlandish pension and entitlement programs, has total debt and liability loads that Arnaud Mares (of Morgan Stanley) pointed out have resulted in a negative net worth for the governments of Germany, France, Portugal, the US, the UK, Spain, Ireland, and Greece. And not by just a little bit, but exceptionally so, ranging from more than 450% of GDP in the case of Germany on the "low" end to well over 1,500% of GDP for Greece.

Such shortfalls can't possibly be funded out of anything other than a very, very bright economic future. Something on the order of Industrial Age 2.0, fueled by some amazing new source of wealth. Logically, how likely is that? Even if we could magically remove the overhang of debt, what new technologies are on the horizon that could offer the prospect of a brand new economic revival of this magnitude? None that I'm aware of.

In the US, the largest capital market and borrower, even the most optimistic budget estimates foresee another decade of crushing deficits that will grow the official deficit by some $9 trillion and the real (i.e., “accrual” or “unofficial”) deficit by perhaps another $20 trillion to $30 trillion, once we account for growth in liabilities. This is, without question, an unsustainable trend.

It’s time to admit the obvious: Debts of these sorts can't be serviced, now or in the future. Expanding them further with fingers firmly crossed in hopes of an enormous economic boom that will bail out the system is a fool’s game. It's little different than doubling down after receiving a bad hand in poker.

The unpleasant implication of various governments going deeper into debt is that a string of sovereign defaults lies in the future. Due to their interconnected borrowings and lendings, one may topple the next like dominoes.

Currency Wars

The currency wars have begun, and the implications to world stability and wealth could not be more profound.

When pressed, the most predictable decision in all of history is to print, print, print. So I can't take credit for a "prediction" that was just slightly bolder than "predicting" which way a dropped anvil will travel; down or up?

The only problem is, widespread currency debasements will further destabilize an already rickety global financial system where tens of trillions of fiat dollars flow daily on the currency exchanges.

You can be nearly certain that every single country is seeking a path to a weaker relative currency. The problem is obvious: Everybody can't simultaneously have a weaker currency. Nor can everybody have a positive trade balance.

If a country or government can't grow its way out from under its obligations, then printing (a.k.a. currency debasement) takes on additional allure. It's the "easy way out" and has lots of political support in the home country. Besides the fact that it's already started, we should consider a global program of currency debasement to be a guaranteed feature of the US economic future.

Conclusion

Three unsustainable trends or events have been identified here. They aren't independent, but they're interlocked to a very high degree. At present I can find no support for the idea that the economy can expand like it has in the past without increasing energy flows, especially oil. All of the indications point to Peak Oil, or at least "peak exports," happening within five years.

At that point it will become widely recognized that most sovereign debts and liabilities won't be able to be serviced by the miracle of economic growth. Pressures to ease the pain of the resulting financial turmoil and economic stagnation will grow, and currency debasement will prove to be the preferred policy tool of choice.

Instead of unfolding in a nice, linear, straightforward manner, these colliding events will happen quite rapidly and chaotically.

By mentally accepting that this proposition isn't only possible, but probable, we're free to make different choices and take actions that can preserve and protect our wealth and mitigate our risks.

What changes in our actions and investment stances are prudent if we assume that Peak Oil, sovereign insolvency, and currency debasement are "locks" for the future?

When it comes to markets riding on a flawed fundamental premise, perception is everything.

Consider that in December of 2007, the world had plenty of food, but by February of 2008, we saw food riots and the international perception of food scarcity. Almost nothing had changed with respect to the fundamental quantities of food stocks between December and February, and that's the point.

Or consider that one month Iceland was in fine shape and the next month desperately broke. Ditto for Greece. Again, there was nothing that had fundamentally changed from one month to the next, in terms of cash flows or debt levels, that would justify the size of the adjustments, but they happened nonetheless, and they happened quickly.
However, it's when we consider the impact of the widespread realization of Peak Oil on the story of growth that the whole idea of sovereign insolvency really assumes a much higher level of probability. More on that later.

For now we should accept that there's almost no chance of growing out from under these mountains of debts and other obligations. We must move our attention to the shape, timing, and the severity of the aftermath of the economic wreckage that will result from a series of sovereign defaults.

Sunday, September 26, 2010

Greed Is Now Being Compared To Cancer.


No fewer than three of the season's new films are focused on Wall Street and its players, each with its own moral message about the way markets are run and who's pulling the strings.

Here,the much awaited Wall Street sequel - Money Never Sleeps looks at the lessons about Wall Street, from the classics of years past to this year's latest offerings.

The Lesson: Beware of bubbles, figurative and literal.

At President Obama's recent town hall meeting a broker asked: Isn't it time to stop treating Wall Street like a piñata? Oliver Stone's answer: Not yet, punk. And now the controversial director has a brand new stick. Wall Street: Money Never Sleeps is the 23-years-in-the-making sequel to Wall Street, the movie that introduced us to trader Gordon Gekko (Michael Douglas) and his catchy slogan, “Greed is good.” Hollywood has always agreed with Wall Street on that point -- that's why they make sequels.

While Douglas returns as Gekko, this year's Charlie Sheen is Shia LaBeouf (the hot Transformer kid), playing a young hotshot with designs on the big score, and also on Gekko's daughter Winnie (Carey Mulligan).

Stone is the kind of director who makes Michael Moore look subtle and here he's at his bludgeoning best, aka worst. More than once he includes shots of actual soap bubbles. For those who have come straight from a screening of Resident Evil: Afterlife, that's known as a visual metaphor. It's what some movies have instead of zombies. As befits the sequel to a 1987 movie, there's a retro feel to the whole thing -- a little bit of '80s flash, but now with derivatives.

My favorite part of the film is the lesson that in the darkest days of any financial tragedy what matters most are love and family. Life goes on," says Lawrence McDonald, author of A Colossal Failure of Common Sense -- The Inside Story of the Collapse of Lehman Brothers, former Lehman Brothers VP of Distressed Debt. " My second favorite part was Michael Douglas' vintage speech on his fictional book lecture tour. He emerges from prison, after collecting his brick-size Motorola cell from the warden, writes a best-selling book and is on stage at a university in New York. In about two minutes and 25 seconds he (and Oliver Stone) do a masterful job describing and explaining the financial crisis."

Despite being flattered by how many lines from his book are used in the movie, McDonald ultimately gives it a mixed review. "I noticed early on there was lots of excitement, applause, and laughter dancing around the theater, but at the end of the film everyone got up and left a little confused, with zero emotion," he says.

The movie, which opens last week, also compares greed to a cancer. Stone can't be blamed for the wincing that will accompany that speech in light of Douglas' recent diagnosis. But at least the actor's feisty performance will remind us why we need to pray for his speedy recovery.

Wednesday, September 22, 2010

This Is Dollar Crisis.


Ben Bernanke's monetary policy has eventually created a currency crisis in the world’s reserve currency.

This crisis has became apparent that the dollar was caught in the grip of the 3-year cycle decline.

There are three conditions that had to be met before I am willing to call the beginning of the end.

-The first condition was for the dollar to move below 82. That was the warning shot that problems were developing.

-The second and third conditions were a move below long-term support (80) and a failed intermediate cycle.

The drop below 80 today has now completed the final two conditions.

I've marked the last three intermediate cycles with the blue arrows (chart above). The move below the last intermediate cycle low today initiates a failed intermediate cycle. This is also an extremely left-translated cycle. Left-translated cycles tend to produce the worst losses as they have a long time to move down. The ongoing cycle shouldn't bottom until it puts in a larger degree yearly cycle low in November or December. I expect that low to test the ‘08 bottom at 71.

Finally we should see a full-on mini crisis by the time the dollar drops into the major 3-year cycle low next spring or early summer.

US deflation just isn't a possibility in a purely fiat monetary system. A determined government can create inflation any time it wants as long as it’s willing to sacrifice the currency. I think it's safe to say the United States has no compunction against destroying the dollar.

The US economy is now heading into an inflationary storm that will expose deflation theory as the pure nonsense that it is.

Thursday, September 16, 2010

Japan's YEN Selling Is Boosting Precious Metals.


Gold broke out of a classic cup-and-handle pattern yesterday right before the Bank of Japan announced it was buying dollars in a bid to weaken the yen. The yen has strengthened significantly since June making life extremely difficult for Japanese export companies. The economy in Japan is weakening and they’re also facing their own sovereign debt issues, which haven't yet surfaced. However, more important is how the markets are reacting. This reaction in the yen will likely be short-lived. Although it may be an immediate Band-Aid, the intervention efforts may be too little for the global forces of supply and demand.

This yen selling didn't transfer to purchasing US dollars. Yesterday and the past several weeks there's been a major rush into precious metals. The dollar’s chart is giving warning signs of an imminent collapse. Certainly the dollar hasn't reacted positively to this announcement.(This will translate into renewed weakness in in Crude Palm Oil as the Ringgit pops.)

The dollar is slicing through its 200-day moving average and the 50-day clearly has acted as resistance. I believe a major transfer of dollars into precious metals is occurring. A death cross is imminent on the dollar and this is occurring simultaneously to new high breakouts on silver and gold.

Usually a weak dollar has been bullish for stock markets as it meant investors were less risk-averse. This isn't the case now. Even though the dollar has fallen since June the markets have failed to rally significantly. Instead, precious metals and mining companies have broken out of key resistance.

The S&P 500 has been in a sloppy and volatile base for four and half months and the poor price volume action tells me a breakout above $114 is highly unlikely. A third failure may be imminent as overbought conditions are combining with previous resistance.

This cup-and-handle pattern in gold is extremely bullish and could be the beginning of a next leg higher. It's a sign of a major consolidation and this recent breakout may bring in more investment interest by institutions who are concerned about currency and sovereign debt issues. SPDR Gold Share’s (GLD) pattern is very rare and this setup tends to indicate a major move into hard assets.

If we see a decoupling of the dollar versus gold continuing, expect to see more buyouts of resource companies from Asia. Right now we're witnessing a massive transition of wealth in the form of currencies (in particular the dollar), bonds, and equities into silver and gold.

Saturday, September 11, 2010

9,Nine,9....


“God does not care about our mathematical difficulties. He integrates empirically.” -- Albert Einstein

“I figure things by mathematics. There is nothing mysterious about any of my predictions. If I have the data I can use algebra and geometry and tell exactly by the theory of cycles when a certain thing is going to occur again.” -- W.D. Gann

Einstein equated gravity to an accelerating rocket. In such a rocket there will be weight and falling. The rocket floor will move upward to meet something that is “dropped.” That's the equivalence principle. Einstein’s ideas revolved around accelerated motion and its effects. He detailed what's equivalent to gravity, explaining that actual gravity though is curved space. That's Einstein’s understanding of real gravity. Space isn’t curved for the accelerating rocket. They are two different things. Einstein, through curved space-time geometry, explained the curvilinear paths of falling objects; why they follow curves.

There's a difference for an accelerating rocket and one just sitting on the earth’s surface. One's moving and experiences weight and the other isn't but still experiences weight. Weight for the accelerating rocket can be calculated by its rate of change velocity. But there's no rate of change of something that isn't moving. Without motion there can be no rate of change.

If one of the foundations for Einstein’s theories is that time isn't a straight line, but curvilinear, then it begs the question: Do cycles repeat?

If space-time is curved in general relativity in both acceleration and gravity, are space and time the same thing? In other words, in relation to the market, are time and price one in the same and when they "meet" does change or the possibility of change take place?

If space-time is curved in general relativity in both acceleration and gravity, hence, the equivalence principle, both gravity and acceleration are the bending of space-time.

In other words, the larger the acceleration, the momentum, the larger the dislocation in places like the market place?

More recently, Bernanke warned that “the recent pace of growth is less vigorous than we expected” and that the economy “remains vulnerable to unexpected developments.”

The confidence associated with the stimulus and that the government "is in charge here" is in jeopardy of becoming a con.

The burst of stock market strength is in danger of becoming a bust.

And, the timing is fascinating, as the first real week of trading in September comes to a close. Walking through all the major S&P swings from 1941. It's apparent that 540-degree moves in time and in price are countertrend or corrective moves of a major degree.

September 9, 2010, is 540 degrees in time from the March 6, 2009 low. The 1104 close on the S&P is 540 degrees down from the August S&P pivot high of 1313/1314 in August 2008, the pivot high just prior to the Lehman Waterfall.

Moreover, the price of 1110 aligns with September 9 as shown on the Square of 9 Chart below. By definition then, since September 9 is opposite March 6, the date of the low is opposite 1110 as well. More importantly, remember that the March 6 low was 90 degrees of 666/667, the price of the low on March 6. Time and price "squared out" at the low.

By definition then, September 9 must square 666/667 as well since it's opposite March 6.

nterestingly, yesterday the S&P gapped up to 1110, precisely making an opening high. At the same time the SPDR S&P 500 (SPY) tagged its overhead 200-day moving average (the SPX marginally missed kissing its 200-dma), with the SPX "Pinocchioing" a declining trendline from this year’s April high and August high.

The normal expectation would be for the longs to take some profits and the SPY to pause at the 200-dma, especially on a gap open following a seven-day run. You can’t get too bearish on that alone. However, despite an up day in the S&P, many of the usual suspects tailed off from the opening and stayed in the red.

What's also interesting about September 9 is the pattern from 1930. I’ve shown the chart of 1930 (above) a few times this year as April marked the retrace high after the November 1929 crash low. But a friend reminded me last night that the second important pivot high in 1930 occurred on September 10.

So in 1930, there was an April high, the high for the year, like 2010 so far. There was a sharp sell-off into early May, like 2010. There was a sharp decline into late June/early July, like 2010. Then there was a last burst of strength off an August low. Like 2010?

Do cycles repeat? Do patterns repeat?

Time is the most important factor in determining market movements, and by studying the past records of the averages or individual stocks you will be able to prove for yourself that history does repeat and that by knowing the past you can tell the future. There is a definite relation between time and price. Now, by a study of the time periods and time cycles you will learn why tops and bottoms are found at certain times and why Resistance Levels are so strong at certain times and bottoms and tops hold around them. The most money is made when fast moves and extreme fluctuations occur at the end of major cycles.
-- W.D. Gann

After the crash into November 21, 2008, there were many on the Street concerned about a repeat of a 50% retracement rally into April 2009 like April 1930. Remember that Bernanke is the preeminent scholar of The Great Depression. Needless to say this fact was not lost on him. The Fed has the same charts we do. Remember that a new president had just been sworn in during the first quarter of 2009.

What better way to "abort a repeat" of the psychology of the cycle from 1930 than "allowing" the market to flush out into March/April 2009?

There's an often used quote of Mark Twain’s as pertains to the market that history, while it may not repeat exactly, often rhymes. It may have become a Street cliché at this point. Be that as it may, clichés are often so called because they are so true.

I can’t help but wonder if the market "skipped a beat" and the April high in 2010 rhymes with the April high in 1930. As traders like to say, “plus or minus one.” What’s one iteration on a yearly time frame?

The bottom line is that the price action following the test of the declining trendline yesterday must be carefully observed. Either the market is on a precipice or a platform. If 1110 can be captured, especially on the important weekly closing basis today, the implication is an extension higher, as offered in yesterday’s piece.

Do cycles repeat? Yesterday I saw a piece on the news that the first time the US was attacked wasn't 9/11 in 2001 but September 10, 1942, when a Japanese bomber dropped two bombs over Oregon. One bomb started a forest fire. The other -- no one knows. September 10, September 11?

It's remarkable that the attack in 2001 came 60 years after Pearl Harbor -- the Master 60-Year Cycle according to Gann (and the Mayans).

I can’t help but wonder how short the fuse is on the situation regarding the move to burn the Koran on the ninth anniversary of 9/11. Nine years, as in Square of 9 charts? The chart is so called because the first square ends with the number 9.

Conclusion: From March 6, 2009, to the April 26, 2010 top is 416 calendar days. On the Square of 9 Chart, 416 aligns with August 30. The market exploded up from the key 1040 level on August 30. The market is respecting this vibration. It could indicate an important low, but momentum and velocity need to confirm the idea of higher prices. Moreover, the message of the 416/August 30 vibration is also that any break of that day's low should see a powerful decline. In other words, the importance of 1040 is underscored, as if we needed one more piece of evidence to tell us that 1040 was the Maginot Line.

At the same time there are a number of good reasons, as you know, cyclically, and otherwise, enumerated in this space that indicate a top of significance anywhere between here and September 22. Add to these cycles and patterns the VIX Compression Sell Signal shown this week and multiple Hindenburg Omen signals, and caution is warranted.

Saturday, September 4, 2010

Double Dip, Anyone?


Federal Reserve Chairman Ben Bernanke said the Fed "will do all it can" to avert a recession and deflation. Bernanke then laid out the four things the Federal Reserve can do to support the economy.

1. First, the Fed can expand quantitative easing (QE). This would most likely come in the form of the Fed expanding its already bloated balance sheet even more.

2. Next, the Fed could extend the zero interest rate policy (ZIRP) even longer. The bond market already expects this to happen which is most likely a reason for the drop in yields this past month as the market is basically signaling there will be no rate cuts until 2014-2015.

3. The Federal Reserve could drop interest rates on reserves (IROR). Lowering this rate would be an attempt to get banks to lend again. I would note, though, that the rate is currently 0.25%. Cutting the IROR down by half or all the way down to zero most likely won't do much.

4. Finally, the Fed chairman notes the Fed could raise the official inflation target. The goal of this final maneuver would be to discourage banks from sitting on their cash.

These options are fine and Mr. Bernanke believes that these tools will help the US keep deflation at rest. In my opinion, the only real option Bernanke has is to keep printing dollars. But as Dr. Ed Yardeni of Yardeni research notes, Bernanke didn't mention this as an option at Jackson Hole.

Nevertheless, here's a quote from Bernanke's 2002 speech on deflation: "By increasing the number of US dollars in circulation, or even by credibly threatening to do so, the US government can also reduce the value of a dollar in terms of goods and services, which is equivalent to raising the prices in dollars of those goods and services."

Even though Bernanke didn't mention his printing press, I still think this is the most likely option and one that the equity markets truly enjoy. Professor Jon Markman did some research and he found that after the Bank of Japan (BOJ) started QE in 2001, the Nikkei went from 8,000 to 18,000. When the BOJ ended QE in 2008, the Nikkei declined all the way back to 8,000. Then here, the Fed started QE in 2009 and the S&P 500 went from 700 to 1,200; since the Fed stopped QE in March of this year, the S&P is down some 12%.

Even though the market has had a rough ride this year, some stocks are performing well, they just aren't conventional ones. A recent Wall Street Journal piece looked at "bunker stocks." The Journal found that companies that supply the essentials for a respectable fallout shelter were trading at or near 52-week highs. Some of the companies the journal featured were Dr. Pepper Snapple (DPS), Cummins (CMI), JM Smucker (SJM), and Hormel (HRL). These companies produce bottled water, canned food, and power generators.

I think more QE is right around the corner; the economy is weak and a double-dip is not a possibility, it's a reality. As Markman said, "I've seen estimates it could amount to as much as $1 trillion this time -- yes, that's with a T -- and do not doubt for a minute that it could happen."

Saturday, August 28, 2010

Anymore Appetite Left For Robert Prechter?


The master of the Elliott wave theory has proven himself time and time again. This time he warns of a massive decline.

No one has tried harder to legitimize technical analysis than modern technical Guru-Supremo Robert Prechter, and over the years he hasn't wavered one iota from his steadfast belief in its predictive power. Launching his career in the early 1970s at the outset of the EMH/Random Walk dynasty and academic-imposed dark ages of technical analysis, he was eager to fight fire with fire and apply scientific methodology to his work.

He slammed a home run in 1978 with his book Elliott Wave Principle that he wrote with A.J. Frost. The book outlined a theory of stock market behavior replete with compelling historical evidence and a bold future forecast based on patterns originating in the past.

Against a rising tide of doom and gloom, Prechter called for a powerful 1980s bull market due to resumption of a wave pattern that started in 1932. This pattern, originally identified by Ralph Nelson Elliott, had been tracked and used to make extremely accurate market predictions in the 1960s by obscure market newsletter writer Hamilton Bolton and Elliott Wave Principle co-author A.J. Frost. Prechter was convinced of the accuracy of the wave principle, and wanted to reveal it to the general public

He virtually stood alone as a stock market bull in 1982. The Dow was at 800 and he was calling for a rise to 3500-4000 and proclaiming the greatest bull market in history was coming. When the rise got underway, the bull market became synonymous with Robert Prechter. He enjoyed celebrity stock market guru status and was a frequent talking head on TV. At least one market pundit even referred to it as Prechter’s bull market. His celebrity status surged even more when he won the US Trading Championship in 1984.

Fame is fleeting however; or, as Robert Prechter believes, it comes in waves. Since he'd plotted his subscription numbers in terms of the same wave pattern that he'd used for his bull market prediction and identified a subscriber peak in late 1987, he was expecting a fall from grace.

He was correct. His stock market guru status was obliterated in the October 1987 stock market crash along with the investing public’s newfound fortunes. Even though he told his newsletter subscribers to get out of the market a few weeks before the 1987 crash, the investing public at large had embraced his higher price targets and the pundits who promoted him as a guru now turned on him.

If there's anything that Paul, the 2010 World Cup octopus oracle, taught us, it's that most people don’t care about the source of good fortune as long as it keeps coming. While Prechter’s goal was to spotlight the methodology behind his accomplishments, few outside of technical analysis professionals and Wall Street firms paid attention or even cared. Main Street was engorged and engaged as the baby boomer generation entered into peak earning years heralding in an era of bigger and better everything, and academia was busy bowing to the golden calf of random price structure.

In addition to the wave pattern Elliott Wave Principle identified up from 1932, which Prechter called the Super Cycle, it identified two larger patterns that it fit into like Russian nesting dolls called the Grand Super Cycle and the Millennium Cycle. Together they represented the three largest Elliott wave structures dating back to the dark ages.

The original version of the book called for the impulse portion (five advancing waves) of the three largest cycles to end in the late 1980s, but when the market recovered from 1987, an alternate count was introduced in 1995, which included a revision stating that the Grand Super Cycle was likely the largest pattern in the confluence of terminating impulse waves, and it was likely to peak that year. Well, that didn’t happen, and Prechter called the top again for 1996, and then in 1996 revised it to 2000.

You can imagine the fun critics of the Elliott wave principle had with all the bad calls. Prechter’s days as a market caller, as far as the general population and critics were concerned, were over.

However, a funny thing happened; all those Whos down in Whoville kept singing. Prechter’s personal newsletter and publishing house, Elliott Wave International (abbreviated EWI), continued to do well through the 1990s right up through today. In a mostly cottage industry where individuals or a handful of employees run market newsletters, Elliott Wave International has 90 employees. While EWI won't reveal its actual number of subscribers, it will say it has subscribers in more than 100 countries.

The bottom line is that serious Elliott wave watchers, though disappointed, weren't dissuaded by the failed projections in the 1990s. Although the five-wave impulse portion of these large-degree cycles extended beyond the ideal Fibonacci targets based on the historical norms of smaller wave sets, the failures were within the rules and guidelines of the wave principle and continued to adhere to Fibonacci proportion.

Above chart shows clear five-wave impulse structure rising through time from 1784 to 2000 (Grand Super Cycle), encompassing another clear five-wave structure up from 1932 (Super Cycle), which nested yet another structure up from 1974 (Cycle), continued to present within acceptable ranges.

But the most compelling evidence is the extremely well-documented Super Cycle run up from 1932 for which key pivots and waves were successfully identified in advance by R.N. Elliott from 1938-1942, Hamilton Bolton in 1960, Charles Collins in 1966, A.J. Frost in 1974, and Robert Prechter in 1982.

Imagine for a moment if these Elliotticians were geologists who predicted earthquakes instead of market pivots with the same accuracy.

However, there's that elusive impulse wave endgame that terminates the advancing portion of the three large cycles that Prechter has been calling for since 1987. One could point out that a lost decade in projecting the termination of a Grand Super Cycle wave (and all nested structures) up from 1784 is still accurate within 95% if it truly ended in 2000. But most people roll their eyes at Chicken Little Prechter’s latest and most dire warning published in a New York Times interview last month.

I think it's more illuminating to ask a question. What impact do the failed projections in the 1990s have on the current interpretation of these large Elliott wave cycles today? The answer is very intriguing. Remember how I explained that sometimes an Elliott wave interpretation can be fine-tuned to one theoretical outcome, or several outcomes that point in the same direction? Well, the answer to my question is that theoretically there are absolutely no Elliott wave options left for price to go higher than the 2007 high at every Elliott cycle level of degree from Grand Super Cycle (1784) to Cycle (1974) without experiencing a decline in magnitude described by Robert Prechter in the New York Times interview.

In other words, Robert Prechter’s lifelong pursuit to prove the validity of the Elliott wave principle is all in, right here, right now. ( check it out now..funk soul brudder..)

Oh, did I mention that he's the author of 14 books on the subject containing thousands of explicit examples of eight-wave cycle structures and Fibonacci proportion in the markets? What is that you say, why didn’t you learn about the Elliott wave principle in college? Good question. I'll just say that I'm pretty sure your grandchildren will.

In March 2008 I expressed my belief in the Elliott wave principle but stopped short of conviction. In 2010, I'm right there with you Robert Prechter. All In Baby.

Sunday, August 22, 2010

The Pattern Day Trader.


In the past, day trading represented the Wild West of the market. It was possible for day traders to move in and out of positions within the trading day and end up with no open positions. This meant it was possible to trade on large volume with little or no cash at risk, meaning no margin requirements. It also meant huge risks for brokers.

For some traders, the whole idea of day trading was a path to easy riches with no risk. It was the fad of the day and it worked -- until the market turned and fell, meaning a lot of portfolios based on accumulated day trades collapsed. And as most traders know, market prices tend to fall more rapidly than they rise.

Trading on such extreme leverage is an attractive idea, but it's not the only motive for day trading. Many traders believe that the risk of price gaps between today’s close and tomorrow’s open are simply too great; day trading enables traders to close out positions during the trading day, avoiding this risk altogether. Even so, if you want to day trade, you could fall into the definition of a “pattern day trader.”

Day trading relies on a high frequency of trades in very short timeframes measured not in days but in seconds. The entry/exit decision is based on momentum, chart patterns, and other technical strategies. Whichever strategy employed, the theme to day trading is that positions close before the trading day’s end. Margin requirements are calculated based on open positions at the end of the day; so day traders following the system end up with no open positions and no margin calls.

This problem, at times representing unacceptable risks to brokers as well as to traders, is what led to the need for enactment of new rules concerning so-called pattern day traders. By definition, you're a pattern day trader if you buy or sell a security within the same day, and follow this pattern four or more times within five consecutive trading days. If you do fall into this definition, you must maintain high margins in equity balances (cash and securities) in your margin account. This balance has to be on hand before you can continue any day trading, once you reach that threshold.

Saturday, August 14, 2010

Dead Cross Is Confirmed.


Several weeks ago I wrote about the death-cross phenomenon in The Death Cross Sell Signal Analyzed. The death cross occurs when the 50-day moving average crosses the 200-day moving average on the downside. These patterns, when combined with other technical indicators, can predict major market downturns. You may have read articles from the bullish camp and from many technicians contending that the death cross isn't a proven or a contrary indicator. I, however, assert that this warning indicator prevented many wise investors who heeded its signal from losing their life savings in 2008.

The recent post-Fed free-fall is confirming the death cross as this will be the third major failure of the 200-day moving average. When a technician starts seeing bearish signs, it's important to look for subtle clues in chart patterns. In this case, the clue was the bearish rising wedge: It's a rally that trades up on decreasing volume. This bearish rising wedge took place concurrently with the right shoulder formation of a head-and-shoulders pattern. This breakdown coupled with bearish price-volume action confirms that selling pressure far exceeds buying. When all these signals happen at the same time, you can expect a rapid downturn to follow. This correction is putting pressure on the 200-day moving average slope. If that moving average begins to slope down, it becomes a heavy area of resistance and will confirm the death cross from early July. The odds of a long-term downtrend are becoming highly probable. These signals could possibly indicate the start of a 12- to 18-month down cycle.

Gold, on the other hand, has shown great relative strength despite the general markets correcting and negative sentiment about the economy from Washington. On July 28, I wrote that gold was reaching major long term trend support and when everyone was selling, it was exactly the time to be buying. That day proved to be a pivot day for gold.

Gold is breaking out compared to the general markets and especially to the euro. It's significantly rallied over the past couple of weeks and has broken above its 50-day moving average, which showed little resistance. Now that 50-day has been broken to the upside, it should act as support as it builds a base to challenge new highs.

The Fed will continue to ease and print money, which should be excellent for gold and silver stocks.