Sunday, May 29, 2011

The 7 Signs.


As a trader who relies on the qualitative art form that is appraising market psychology, I have been collecting some interesting anecdotes and observations from the field. Specifically, traders seem to be ignoring some of the more readily apparent hazard signals the market has been throwing off in the past month.

1. I have repeatedly heard and read to the same effect, "the market is hanging in there, considering...(x y z)." While that is certainly the case broadly speaking, the market has a way of distracting your attention from where it should be focused most. The rampant attention and bipolar swings in investor sentiment surveys appear to be the illusion of choice in declaring the waters safe for the return of risk. I believe there is some utility in knowing where the sentiment vane is pointing over the very short term, however, the market's technical structure typically trumps sentiment (unless it is at a statistical extreme such as in March 2009) over time. If anything, the fact that the market is "hanging in there" on a relative basis could actually portend a more serious underlying condition indicative of distribution. Distribution by institutional participants can create broadening top formations in the indices and erratic sentiment surveys by the swinging price action.

2. A major momentum darling has crashed and burned with silver. Silver's historic decline, coupled with a very shallow bounce, is bearish toward risk returning to the same degree of indiscrimination it represented before it broke down. You could even speculate that the tepid action in stocks like Apple (AAPL) over the past six months was a precursor to the diminishing influence on the risk/momentum continum.

3. The indices all broke their respective 50-day moving averages this week. Friday's action was interesting, considering they were all siting directly beneath them after retracing the break.

4. Ignoring the symmetry and historical context in the two charts below would be Pollyannish at best, irresponsible to risk at worst. Furthermore, knowing what we now know about the developments in Europe and the risks they have going forward -- specifically over the next few weeks in Spain and Greece -- their respective influences to the commodity and equity markets could be strongly reinforcing.

5. The government bond market continues to confuse. The chart above shows the relative disconnect over the past year. This chart should be qualified, in that yields have been in a downtrend relative to the SPX for almost three decades. With that said, the degree of yield erosion relative to the SPX over the past two months should not be ignored or passed off as insignificant.

6. Weekly economic data surveys have taken a turn negative. Whether revealed in the most recent weekly unemployment trends or decelerating GDP, the market is facing an ever more hostile headline risk environment. I typically shy away from incorporating economic data surveys into my short-term calculus because their correlations are erratic at best. But considering the backdrop, it can pay off with timing. Next week will provide the important ISM manufacturing index. Above is a chart of the Empire, Philly & Richmond surveys overlaid on the ISM survey. As the correlations have shown, the already received EPR surveys indicate the ISM will likely be quite weak. The degree of which could be a catalyst (both positive or negative) in the market.

7. The market has respected my monthly meridian chart to the tick. If May continues to follow course away from the meridian at 1363, the June-July months could see an acceleration to the downside.

Overall, I'm skeptical to hanging onto long positions for anything more than a bounce here and feel more comfortable on the short side of the market. That could all change in an instant, and I try to never limit myself from trading the flip side as revealed by my agnostic trading approach.

Wednesday, April 27, 2011

"Tonight's....The... Night...."


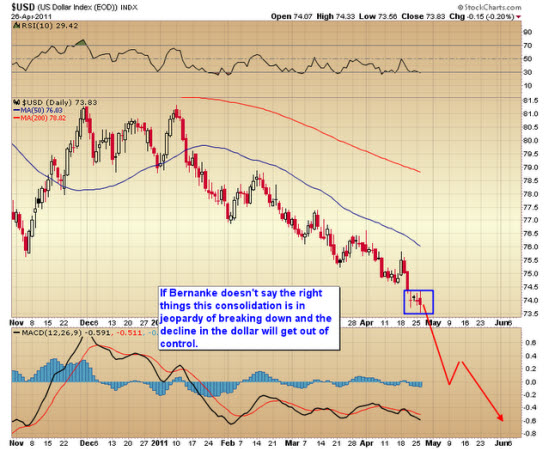
TONIGHT's FOMC meeting and press conference has the potential to either put in a daily cycle bottom in the USD index or initiate a waterfall decline into the dollar's three-year cycle low. There is a lot riding on this meeting.

Let me explain. Today will be the 26th day of the current dollar cycle. That cycle typically lasts about 20-25 days. So it's already starting to stretch here. The last few days the dollar has been consolidating while it waits to hear what the Fed has to say. I suspect if the Fed clearly states it will close down QE2 in June that will give the dollar the impetus for another dead-cat bounce.

Make no mistake though: This will only be a dead-cat bounce. Just because Benny-boy ends QE2 in June doesn't cure the problem of the trillions of dollars he's already printed. The foolish attempt to print prosperity is going to have dire consequences; it is going to cause a dollar crisis. There's no way Bernanke can avoid that now. The damage has already been done. There's no way to push the toothpaste back in the tube!

In the event that the Fed does clearly state their intention to end QE (and I think this is the most likely scenario) the minor dollar rally should drive a continuing correction in gold and silver. They are due for a daily cycle correction. It will only be a correction though. The dollar catastrophe isn't done yet and gold's C-wave still has further to go (a lot further).

The other scenario, and the one I think is less likely, is Bernanke doesn't state a clear intention to halt QE and the dollar tanks, thus initiating a final dollar crisis immediately.

Only a Keynesian academic would think lasting prosperity can be created, with no unintended consequences, by printing money. But it would be crazy to risk sending the dollar over the cliff that it's hanging on. Bernanke had better say the right things tonight or all hell is going to break loose in the currency markets.

Sunday, April 17, 2011

The Impact Of Budget Woes.


Regardless of whether a compromise is reached over the approaching lockdown of the United States ceiling and the raising of the debt, this impasse has momentous significance for holders of gold (SPDR Gold Shares (GLD) and silver (iShares Silver Trust (SLV). The serious weaknesses of the US economic structure is exposing it as a paper tiger. Instead of seeking fiscal sanity, the inability of our leaders to agree on even the smallest of issues is reminiscent of the Roman Empire dealing out bread and circus to the masses when Rome could no longer afford the good times and the games.

Let’s look at their pathetic reality. US legislators are unable to come up with as little as 2% of a total budget measured in the trillions. While the Republicans and the Democrats are separated by only several billions, the underlying issues are ignored. This may be because they are witnessing political theater in a dress rehearsal for the 2012 election. The actual battlefields on which both sides face one another are not only fiscal, but ideological as the debate raged over Planned Parenthood funding. The media in their attempt to sell newspapers and program time sensationalize the basic issues. Simply put, the US is approaching insolvency. Their ship of state is sailing straight into a sea of icebergs. Sooner or later they will have to come to grips with the urgent reality that belts will have to be tightened. If they do not sober up to the reality of our situation, the decision to keep her national vessel afloat will occur whether they like it or not.

Remember that they have to borrow forty-three cents out of every dollar that thet use to pay for their expenses. To put it succinctly, 50% of the US population pays no taxes. The revenues to pay their national debts are coming off of the hides of the middle class, the wage earners and the small businesses. It is somewhat peculiar that the basic truths for their survival are not mentioned. Do not be diverted by the ambient noise that tends to complicate the issue. They have been sidetracked by irrelevant issues; they are spending themselves into a financial quagmire. This is hurting the hard-working middle class who are dealing with a deteriorating US dollar (PowerShares DB US Dollar Index Bullish (UPP) and simultaneously carrying the load of increased tax burdens. Also long-term yields are rising and institutional investors are selling their US debt holdings raising long-term yields.

It would all be worthy of a Fellini farce if it weren't so sad. The situation cries out for solutions I've proposed in the heat of the financial meltdown, concentrating on precious metals and key natural resource stocks to hedge against a dollar devaluation and burgeoning debts.

What goes completely unmentioned is the role of the Fed in the entire equation. The Federal Reserve Bank is the one factor in this equation that has the unquestioned, uncontrolled power to change unexpectedly the best laid plans. The Fed is omnipresent, omniscient and omnipotent. All this time it watches and waits. One change in the Fed discount rate, one raise in margin, one change in the direction of interest rates and quantitative easing by the Imperial Fed can rewrite the whole script. They are accountable to no one and answer to no one. They can and have, if needed, print fiat money and cheap paper to obfuscate growing budget deficits. All eyes are on QE ending in June and what will occur with long-term interest rates. As the act continues in Washington, as the Democrats and Republicans try to show the masses who is more fiscally prudent, the reality is that the Fed will have to continue printing cheap dollars to pay off huge debts. Investors realize this and that is why I am seeing these major moves in gold.

Let us keep a firm hand on the wheel and steer a sound course with the compass tuned to the North Star of our technical discipline. It is important to remember that the charts give us clues during this treacherous times and allows us to go where the smart money is moving.

We are living in extremely volatile times and the market will play on our mind and emotions. That is why it is crucial that we become stronger than the average investor who easily gets caught up with the herd mentality. These amateur investors get aggressive at overbought levels and dump their positions during sell-offs. Remember when you invest in anything you become subject to inner feelings of anxiety and greed. You need to realize that a technical system protects you from becoming subject to the dangerous, contagious emotions of the investment community. I have unfortunately learned that what takes you months to earn can be taken from you in a matter of days.

The gold silver:ratio has dramatically favored silver since I wrote that. Silver is extremely volatile and has often in the past exceeded its measured targets. It is much less reliable for timing purposes than gold and could easily overshoot my late January $40 target. The US dollar is heading into new lows without showing any sort of dead cat bounce, which is quite concerning. Investors have flocked to the Euro (CurrencyShares Euro Trust (FXC)) which is quite dangerous for some countries paying back huge debt burdens and for countries who rely on exporting overseas. Do not be surprised if we see some economic weakness resurfacing in the eurozone.


Thursday, April 7, 2011

Yen Carry Trade May Return.


Japan had lost the race to the bottom against the US. " Ben, Ben, he’s our man / if he can’t print ‘em / no one can! "

As the risk of yen revaluation in deflationary Japan exceeded the risk of dollar inflation in the US -- where the Fed declared its intentions to have inflation rise and then abjured responsibility for inflation when it did rise and as Japan’s customers were forced into “must-do” trades for buying the YEN to pay their Japanese suppliers -- why would anyone take the risk of borrowing the yen when they could borrow the dollar instead?

Now the US is faced with the situation where the G-7 central banks have arrested the upward spike in the yen threatened after the country’s disasters and affirmed the old highs just under 80 as resistance. The net result of this move is a global borrower can now borrow the yen without fear of further revaluation!

The Dollar Carry Into the Yen

If we turn the trade around and look at the two components of the dollar carry into the yen, the interest rates spread and the spot rate return, we can see just how meaningless the interest rate component has been since the US went to a zero interest rate policy in December 2008. The spot rate return on borrowing the dollar and lending the yen has moved higher as Japan has been unable to break away from its deflationary miasma while the Federal Reserve has convinced investors the US will, one day, defeat the deflation that never existed.

Reviving the Yen Carry Trade

If the US does adopt an exit strategy from QE2 and the dollar becomes more expensive to borrow while the yen is not at risk of running away to the upside, the wider interest rate gap between the US and Japan will make Japan the preferred funding source once again. As noted last November, this has not been the case since the financial crisis; we can match the carry return of the dollar into a basket of emerging market currencies quite closely, but the yen carry trade has been irrelevant.

Where does this lead? If the dollar carry seized the baton from the yen carry trade and allowed all manner of emerging market assets to shoot higher in 2009 and most of 2010, then the yen carry trade can return the favor and finance the US should the Federal Reserve adopt an exit strategy. US would tighten; they would un-tighten for the US.

That would be quite bullish for US financial assets should events unfold this way.

Wednesday, March 23, 2011

The USD Endgame.


The dollar came under extreme pressure again. I expected it to happen in the March. Many people thought I was nuts. They were sure it was the euro that would collapse, despite the fact that the EU is doing everything it can to protect its currency while Fed Chairman Ben Bernanke is doing everything he can to destroy the USD.

On Friday the last confirmation occurred to signal the final collapse is now underway. On Friday the November yearly cycle low was violated. Cyclically this event is a major catastrophe.

We are now going to see the dollar get absolutely hammered for the next couple of months. The viability of the dollar as a currency will be questioned. There is a decent chance it may start to lose its status as the world's reserve currency. (Coincidentally, about the time everyone becomes convinced the dollar is going to hyper inflate will be the point where the three-year cycle low will bottom and we will see an explosive rally, along the same lines as what happened in the latter half 2008.)

This is what all the top pickers in gold and silver fail to understand. They are all trying to call a top based on charts without any understanding of what is happening to the currency.

In a currency collapse the market will flee into assets that will retain their purchasing power. Four weeks ago we went past the point of the stock market being able to protect one from Bernanke's printing press any longer. So buying stocks as a protection is no longer a viable solution.

Four weeks ago spiking inflation rose to the point where profit margins are now being hit. Bernanke will no longer be able to prop up the stock market by further debasing of the currency. Stocks have now decoupled from their inverse correlation with the dollar and will now follow the dollar down.

The more Bernanke prints and the faster the dollar collapses, the faster the stock market is going to fall... and the quicker the economy is going to roll over into the next recession.

What will happen is that liquidity will rush into the commodity markets as the only true protection against the accelerating currency crisis.

This is why one has to ignore the top pickers. Overbought oscillators and stretched conditions are meaningless in a currency collapse. This is all about fundamentals. It's about protecting your purchasing power. You can't do that by exiting the one sector fundamentally best suited to protect you during this storm, which is precious metals.

Now isn't the time to be selling your gold, silver, or mining stocks, it’s time to be buying more.

Sunday, March 20, 2011

Could This Be A Technical Case for a Continuing Bull Run ?


Many key stocks are now testing their 200-day moving averages bottoming out, or is their behavior the sign of the bear?

Is this a pause to refresh and just another correction or the start of something more pernicious?

Market history reflects that deep corrections in bull trends such as what occurred from the April top into July 1 are seldom followed up by similar deep corrections over the next 12 months or so.

Consequently, if another deep correction plays out, it will signal a bigger picutre bear market, not a continued new bull market.

And this correction is deeper so far than the November correction. The percentage of NYSE stocks below their 50-day moving averages shows that the percentage of stocks ABOVE their 50 dma’s is just 40%. Put another way, more than half of NYSE stocks are below their 50 dma’s - below the November correction threshold.

Does this "overbalance" of the reading from November indicate a change in trend?

At the same time when 50% or more of stocks hit new 20-day lows, a snapback often times plays out. This occurred on last Wednesday. The snapback came in on cue.

With the S&P tagging the levels where the year opened on Wednesday, it was a likely place for a rally attempt to play out. However, with the average portfolio as reflected by the NYSE percentage above the 50 dma probably below water for the year now, will the animal spirits be able to generate traction?

Previously I thought that a snapback attempt would stick and not to be too eager to short into it and that trade over initial resistance near 1272 implied a run to second resistance near 1290.

The Daily Swing Chart above has not turned up and will eventually. If a higher open on Monday will trace out the first Minus One/Plus Two Sell pattern since the S&P stabbed below its 50 dma. Why? Because the 3 Day Chart is down and two consecutive higher lows assuming we get that Monday will carve out the Plus Two part of the setup.

This will coincide with a backtest of the 50 dma setting up a solid risk to reward short.

Even if the market is tracing out another bullish correction, I think there should be one more move down below Wednesday’s low, likely to 1235ish.

Last week, a friend sent me a chart of the S&P with the following Elliott Wave labeling. Note that another hit at the top of the channel comes in at 1400.

Recently, I mentioned that 1401 is opposite February 18. If the S&P should extend to 1401 following the current correction, it will be squaring out the February 18 high.

The above Square of 9 Chart shows that 1254 is 180 degrees down from the 1344 high. On Wednesdays surge lower, the S&P tagged 1249 intraday, closing at 1254. It is possible that this marks the low of the correction, but the level should be tested or undercut, possibly to 1235. If this is a correction in a bull market then as The Wheel shows 360 degrees up from Wednesday’s low equates with 1400 which ties to the upper end of a daily S&P channel.

Strategy: It looks like we’re in a big "B" wave up, with a big "C" wave decline to come, so I would not be long over the weekend. A decline below 1254 suggests an extension to at least 1235.

Tuesday, March 15, 2011

Mirroring The Crash In 1987.


Debt is a drug that was sanctioned by the Bretton Woods Agreement in July 1944.

The question is, if a tree is felled in the forest for the purpose of printing more dollars, does anyone hear it if they’re not in the forest?

I think it is fair to say that in denseness of the world currency system, it is next to impossible to tell the trees from the forest.

On August 15, 1971, the US unilaterally terminated convertibility of the dollar to gold. As a result, the Bretton Woods Agreement was de facto ended.

The US dollar became the sole backing of currencies and the reserve currency for member states.

The thing is that fiat monies seldom last more than 40 years. 2011 is the 40th year since Nixon tuned the US dollar into a fiat currency.

Forty days and 40 nights in the desert, the biblical day for a year?

The Fed probably relishes all the talk of deflation mongering while it is printing with both hands as the chatter holds down long-term interest rates.

But, how long will it be until the bond and stock markets begin to discount a disaster of compounding?

What I mean by that is the interest on the US national debt is now around $375 billion annually. In 2020 interest costs will double to $750 billion annually. That assumes interest rates will stay in this vicinity. That is a huge and inordinate chunk of a $14 trillion GDP. US'S creditors will probably want higher interest to make up for the increasing risk as the compounding goes on.

I can’t help but wonder if the quake in Japan will bring things to a head sooner rather than later with the Bank of Japan (BOJ) failing to show at one of US's bond auctions.

This is at a time when the dollar is already under pressure which is underscored by the recent fact that it has not responded to its traditional role as a safe haven. The US dollar seems to have lost its grip on its status as the world reserve currency given its poor price action since the unrest in the Midle East.

Moreover, there may be a huge amount of Japanese liquidation going into their fiscal year end at the end of March. If so, the Street could be caught short puts and long stocks on this "pullback opportunity" -- just like they were during the October expiration in 1987 and ensuing crash. Tuesday should be the tell if they are for sale for expiration: I would watch the big heavyweights, which were pretty much all to the downside except for Apple on Monday. If they don’t rally on Tuesday, the market is vulnerable into Friday. As offered last week, the bulls could experience a blood bath.

Monday was an important day because the Monthly Swing Chart on the S&P turned down. This is only the fourth time it has turned down since the low in March 2009. The behavior from this turndown will be important to observe. The normal expectation when a big wheel of time such as the monthly turns down is for a snapback rally over the next few days in keeping with the Principle of Reflexivity. That snapback attempt may have begun yesterday with the market recovering roughly half its losses. Maybe. Again if the expiration is for sale, all bets are off.

There is a good excuse technically for the S&P to attempt a one- to three-day rally however. The S&P satisfied a measured move at 1282 on Monday. The first move down off the 1344 high was 50 points while a similar 50 point decline off the last swing high (1332 on March 1) equates to 1282. However, 180 degrees down in price from the 1344 high is 1272 which has not yet been satisfied. A down open on Tuesday which tests toward this level could set up a reversal.

That being said the defense team is on the field. There is a lot going on out there besides the fact that the technical condition of the market is in a weak position: The S&P has closed below its 50 dma for the first time since the September 2010 kickoff. The index has also snapped a rising trendline from those lows. So, let’s keep it simple and try not to second-guess things. Surprises happen in the direction of the trend. The problem is that there is always a primary trend and a secondary trend working concurrently like twin strands of DNA. The secondary trend may have broken but the primary trend may still be intact.

The behavior this week following the turndown in the monthly chart will tell us something about the nature of the intermediate trend and the position of the market.

Let’s take a look at the prior instances where the monthly chart on the S&P turned down since the March ’09 low. The first turn down occurred in July ’09. The S&P turned right back up leaving a bullish outside up monthly bar. The first turndown in the big monthly chart found low almost immediately and turned back up vigorously signaling that the market’s agenda was higher. The next turn down of the monthly chart occurred in January 2010. The correction carved out the first Plus One/Minus Two buy set up since the low. Why? The move into February 2010 was the first pattern of 2 consecutive lower monthly lows since the March ’09 low.

Once again the market rallied vigorously into April 2010. From there the Monthly Swing Chart turned down again. However, the action was conspicuously bearish with the S&P accelerating to the downside on the monthly turndown. Another Plus One/Minus Two set up played out on two consecutive lower lows into June. However, the S&P made a slight new low on the first trading day of the new month, July, which carved out an important pattern: The lower low in July left three consecutive monthly lows for the first time since the March ’09 low. The Three Month Chart had turned down. The S&P rallied off the set up but the first turn-up of the monthly in August defined a high suggesting the position of the market was bearish. However, significantly, the S&P never turned its monthly back down. The monthly low remained the July low near 1010 S&P and has remained up -- until Monday.

Note that the move up from March ’09 to the April 2010 top was 13 months with the turn down coming on the 14th month. From the turn-up in August 2010 following the July 2010 low the S&P ran up seven months.

Typically, these six- to seven-month and 13- to 14-month counts are critical to keep count of.

What is interesting is that the range from the 666 S&P low to the April 2010 high is 554 points. Adding 554 points to the 1010 low gives 1564 which ties to the all time S&P high.

The normal expectation from the perspective of pattern would be for a textbook backtest of the April/November highs around 1225 S&P. I can’t help but wonder if after a multi-month decline that the S&P rallies up culminating in tag of 1400 and the upper channel as show completing another 13- to 14-month run periodicity from the June/July 2010 lows. In other words, following this correction, it's possible that the S&P will run up into July or August. July being the anniversary of the 2007 Initial Top and August being opposite or 180 degrees from this year’s February 18 peak.

On the Square of 9 Chart, 1401 is opposite February 18.

Conclusion: 270 degrees in price down from the 1344 high is 1235 which ties to the idea of a backtest of the April/November 2010 highs. A full 360 degree decline off the February high is 1201 which ties to a backtest of the 50-month moving average. In my opinion the primary trend will remain up as long as 1177 which is 50% of the range from 1010 to 1244 holds. It is no coincidence that 1177 ties to the 1173 low in November. Got geometry?

The Quarterly Swing Chart low for the duration of the first quarter of 2011 which has very little time to run comes in at the early October low in 2010 at 1131.84.

The quarterly range from that low to 1344 is 212 points. The mid-point of the range is 1238 which also ties to a back test of the April/November 2010 highs.

The current quarterly low for the first quarter occurred at the beginning of January at 1257.59.

It the S&P slices through 1272 like a knife through butter, it should make a beeline to 1257 and the quarterly low. Below 1257 the S&P could quickly waterfall to 1235.

Strategy: For the last few weeks I’ve reflected on the analogue of the 1987 crash with our February top this year being opposite the February 24 top in 1987. If option expiration was for sale it could be a blood bath eliciting fears of an ugly quarter end for portfolio managers. The crash in 1987 was the Monday after options expiration.

The crash in 1987 was 24 years ago. There is a compelling vibration with 24 squaring the date of February 18, the high, which squares by definition August 24, the high in 1987.

The crash in 1987 played out when a correction in October that mirrored a correction some four months prior failed to hold and the "mirror" broke. I have been pointing to the fact that the current correction has mirrored the correction in November, some four months ago. That is until yesterday. Yet yesterday was accompanied by a strange complacency just as has the devastation in Japan and the unrest in the Middle East been greeted by the market with an unusual complacency as to potential negative financial consequences. I have been warning that if the pattern of the prior correction from last November breaks, the market may go with it as it did in 1987.

Despite an oversold short-term condition, I remind myself that crashes are born not of too much bullishness but of too much complacency, and that the most bearish thing a market can do is continue lower despite it being oversold -- just as the most bullish thing the market did in recent months was continue higher despite being overbought. I remind myself that markets don’t crash directly off tops, but off lower tops. We have a lower top in place in the short-term picture from the February 18 high. Widening the lens, in the big picture, we have what may be a lower high in place from the all-time high.

If the S&P knifes and stays below 1270 on Tuesday, I would not try to catch falling daggers. The plains are littered with the bodies of heroes.