Saturday, August 28, 2010

Anymore Appetite Left For Robert Prechter?


The master of the Elliott wave theory has proven himself time and time again. This time he warns of a massive decline.

No one has tried harder to legitimize technical analysis than modern technical Guru-Supremo Robert Prechter, and over the years he hasn't wavered one iota from his steadfast belief in its predictive power. Launching his career in the early 1970s at the outset of the EMH/Random Walk dynasty and academic-imposed dark ages of technical analysis, he was eager to fight fire with fire and apply scientific methodology to his work.

He slammed a home run in 1978 with his book Elliott Wave Principle that he wrote with A.J. Frost. The book outlined a theory of stock market behavior replete with compelling historical evidence and a bold future forecast based on patterns originating in the past.

Against a rising tide of doom and gloom, Prechter called for a powerful 1980s bull market due to resumption of a wave pattern that started in 1932. This pattern, originally identified by Ralph Nelson Elliott, had been tracked and used to make extremely accurate market predictions in the 1960s by obscure market newsletter writer Hamilton Bolton and Elliott Wave Principle co-author A.J. Frost. Prechter was convinced of the accuracy of the wave principle, and wanted to reveal it to the general public

He virtually stood alone as a stock market bull in 1982. The Dow was at 800 and he was calling for a rise to 3500-4000 and proclaiming the greatest bull market in history was coming. When the rise got underway, the bull market became synonymous with Robert Prechter. He enjoyed celebrity stock market guru status and was a frequent talking head on TV. At least one market pundit even referred to it as Prechter’s bull market. His celebrity status surged even more when he won the US Trading Championship in 1984.

Fame is fleeting however; or, as Robert Prechter believes, it comes in waves. Since he'd plotted his subscription numbers in terms of the same wave pattern that he'd used for his bull market prediction and identified a subscriber peak in late 1987, he was expecting a fall from grace.

He was correct. His stock market guru status was obliterated in the October 1987 stock market crash along with the investing public’s newfound fortunes. Even though he told his newsletter subscribers to get out of the market a few weeks before the 1987 crash, the investing public at large had embraced his higher price targets and the pundits who promoted him as a guru now turned on him.

If there's anything that Paul, the 2010 World Cup octopus oracle, taught us, it's that most people don’t care about the source of good fortune as long as it keeps coming. While Prechter’s goal was to spotlight the methodology behind his accomplishments, few outside of technical analysis professionals and Wall Street firms paid attention or even cared. Main Street was engorged and engaged as the baby boomer generation entered into peak earning years heralding in an era of bigger and better everything, and academia was busy bowing to the golden calf of random price structure.

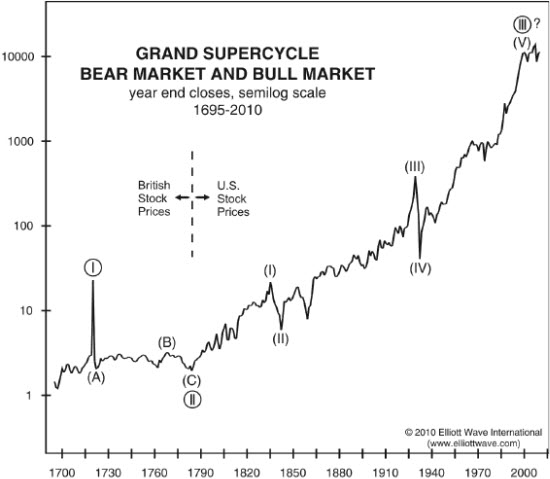
In addition to the wave pattern Elliott Wave Principle identified up from 1932, which Prechter called the Super Cycle, it identified two larger patterns that it fit into like Russian nesting dolls called the Grand Super Cycle and the Millennium Cycle. Together they represented the three largest Elliott wave structures dating back to the dark ages.

The original version of the book called for the impulse portion (five advancing waves) of the three largest cycles to end in the late 1980s, but when the market recovered from 1987, an alternate count was introduced in 1995, which included a revision stating that the Grand Super Cycle was likely the largest pattern in the confluence of terminating impulse waves, and it was likely to peak that year. Well, that didn’t happen, and Prechter called the top again for 1996, and then in 1996 revised it to 2000.

You can imagine the fun critics of the Elliott wave principle had with all the bad calls. Prechter’s days as a market caller, as far as the general population and critics were concerned, were over.

However, a funny thing happened; all those Whos down in Whoville kept singing. Prechter’s personal newsletter and publishing house, Elliott Wave International (abbreviated EWI), continued to do well through the 1990s right up through today. In a mostly cottage industry where individuals or a handful of employees run market newsletters, Elliott Wave International has 90 employees. While EWI won't reveal its actual number of subscribers, it will say it has subscribers in more than 100 countries.

The bottom line is that serious Elliott wave watchers, though disappointed, weren't dissuaded by the failed projections in the 1990s. Although the five-wave impulse portion of these large-degree cycles extended beyond the ideal Fibonacci targets based on the historical norms of smaller wave sets, the failures were within the rules and guidelines of the wave principle and continued to adhere to Fibonacci proportion.

Above chart shows clear five-wave impulse structure rising through time from 1784 to 2000 (Grand Super Cycle), encompassing another clear five-wave structure up from 1932 (Super Cycle), which nested yet another structure up from 1974 (Cycle), continued to present within acceptable ranges.

But the most compelling evidence is the extremely well-documented Super Cycle run up from 1932 for which key pivots and waves were successfully identified in advance by R.N. Elliott from 1938-1942, Hamilton Bolton in 1960, Charles Collins in 1966, A.J. Frost in 1974, and Robert Prechter in 1982.

Imagine for a moment if these Elliotticians were geologists who predicted earthquakes instead of market pivots with the same accuracy.

However, there's that elusive impulse wave endgame that terminates the advancing portion of the three large cycles that Prechter has been calling for since 1987. One could point out that a lost decade in projecting the termination of a Grand Super Cycle wave (and all nested structures) up from 1784 is still accurate within 95% if it truly ended in 2000. But most people roll their eyes at Chicken Little Prechter’s latest and most dire warning published in a New York Times interview last month.

I think it's more illuminating to ask a question. What impact do the failed projections in the 1990s have on the current interpretation of these large Elliott wave cycles today? The answer is very intriguing. Remember how I explained that sometimes an Elliott wave interpretation can be fine-tuned to one theoretical outcome, or several outcomes that point in the same direction? Well, the answer to my question is that theoretically there are absolutely no Elliott wave options left for price to go higher than the 2007 high at every Elliott cycle level of degree from Grand Super Cycle (1784) to Cycle (1974) without experiencing a decline in magnitude described by Robert Prechter in the New York Times interview.

In other words, Robert Prechter’s lifelong pursuit to prove the validity of the Elliott wave principle is all in, right here, right now. ( check it out now..funk soul brudder..)

Oh, did I mention that he's the author of 14 books on the subject containing thousands of explicit examples of eight-wave cycle structures and Fibonacci proportion in the markets? What is that you say, why didn’t you learn about the Elliott wave principle in college? Good question. I'll just say that I'm pretty sure your grandchildren will.

In March 2008 I expressed my belief in the Elliott wave principle but stopped short of conviction. In 2010, I'm right there with you Robert Prechter. All In Baby.

Sunday, August 22, 2010

The Pattern Day Trader.


In the past, day trading represented the Wild West of the market. It was possible for day traders to move in and out of positions within the trading day and end up with no open positions. This meant it was possible to trade on large volume with little or no cash at risk, meaning no margin requirements. It also meant huge risks for brokers.

For some traders, the whole idea of day trading was a path to easy riches with no risk. It was the fad of the day and it worked -- until the market turned and fell, meaning a lot of portfolios based on accumulated day trades collapsed. And as most traders know, market prices tend to fall more rapidly than they rise.

Trading on such extreme leverage is an attractive idea, but it's not the only motive for day trading. Many traders believe that the risk of price gaps between today’s close and tomorrow’s open are simply too great; day trading enables traders to close out positions during the trading day, avoiding this risk altogether. Even so, if you want to day trade, you could fall into the definition of a “pattern day trader.”

Day trading relies on a high frequency of trades in very short timeframes measured not in days but in seconds. The entry/exit decision is based on momentum, chart patterns, and other technical strategies. Whichever strategy employed, the theme to day trading is that positions close before the trading day’s end. Margin requirements are calculated based on open positions at the end of the day; so day traders following the system end up with no open positions and no margin calls.

This problem, at times representing unacceptable risks to brokers as well as to traders, is what led to the need for enactment of new rules concerning so-called pattern day traders. By definition, you're a pattern day trader if you buy or sell a security within the same day, and follow this pattern four or more times within five consecutive trading days. If you do fall into this definition, you must maintain high margins in equity balances (cash and securities) in your margin account. This balance has to be on hand before you can continue any day trading, once you reach that threshold.

Saturday, August 14, 2010

Dead Cross Is Confirmed.


Several weeks ago I wrote about the death-cross phenomenon in The Death Cross Sell Signal Analyzed. The death cross occurs when the 50-day moving average crosses the 200-day moving average on the downside. These patterns, when combined with other technical indicators, can predict major market downturns. You may have read articles from the bullish camp and from many technicians contending that the death cross isn't a proven or a contrary indicator. I, however, assert that this warning indicator prevented many wise investors who heeded its signal from losing their life savings in 2008.

The recent post-Fed free-fall is confirming the death cross as this will be the third major failure of the 200-day moving average. When a technician starts seeing bearish signs, it's important to look for subtle clues in chart patterns. In this case, the clue was the bearish rising wedge: It's a rally that trades up on decreasing volume. This bearish rising wedge took place concurrently with the right shoulder formation of a head-and-shoulders pattern. This breakdown coupled with bearish price-volume action confirms that selling pressure far exceeds buying. When all these signals happen at the same time, you can expect a rapid downturn to follow. This correction is putting pressure on the 200-day moving average slope. If that moving average begins to slope down, it becomes a heavy area of resistance and will confirm the death cross from early July. The odds of a long-term downtrend are becoming highly probable. These signals could possibly indicate the start of a 12- to 18-month down cycle.

Gold, on the other hand, has shown great relative strength despite the general markets correcting and negative sentiment about the economy from Washington. On July 28, I wrote that gold was reaching major long term trend support and when everyone was selling, it was exactly the time to be buying. That day proved to be a pivot day for gold.

Gold is breaking out compared to the general markets and especially to the euro. It's significantly rallied over the past couple of weeks and has broken above its 50-day moving average, which showed little resistance. Now that 50-day has been broken to the upside, it should act as support as it builds a base to challenge new highs.

The Fed will continue to ease and print money, which should be excellent for gold and silver stocks.

Sunday, August 8, 2010

The World's Most Unusual Market - The Pirate's " Stock Market".


The Syrian-crewed MV Syria Star, flagged in Saint Vincent and Grenadines and transporting an estimated 23,755 cubic meters of sugar, was seized by Somali pirates in the Gulf of Aden yesterday.

The pirates seem to have timed the market fairly well, after raw sugar futures for October delivery on the ICE (ICE) exchange hit a four-month high of 18.52 cents/lb. this week. Apparently, it's due to a logjam at Brazil’s ports (Brazil is the world’s largest sugar exporter), where ships are waiting up to a month and a half to load supplies and set sail (the usual time is about two weeks).

Usually, pirates are after ransom, not cargo—but they tend to target high-value shipments. This time, they’re headed back to shore with 23,755 cubic meters of deliverable sugar, currently trading at a spot price of 24.37 cents/lb. A quick back-of-the-envelope estimate shows that 23,755 cubic meters would accommodate approximately 53,247,825 lbs of sugar—with the right broker, they could do quite well.

The probability of the pirates’ purloined sugar entering the market is low, to say the least. However, even if they were able to sell it, money manager Shawn Hackett, founder and CEO of Hackett Financial Advisors, a firm with a focus on agricultural commodities, contends they got in too late.

“There’s no scarcity of sugar”. “This is just a temporary, short-term rise in sugar prices because of the transport problems Brazil is having. That’ll get resolved quickly, and besides, India, the other sugar-producing country the world relies on, just came in with a record-setting crop.”

So, the pirates may have been better off just going the ransom route, as is their usual MO.

Container vessels generally sail too high off the water for Somali pirates and are relatively fast. Thus, tankers and dry bulk ships that carry oil, chemicals, coal, wheat, and other commodities are more desirable targets.

The Saudi-owned Sirius Star, was hijacked in November, 2008. It was carrying two million barrels of oil worth $100 million, and was finally released on January 11, 2009, after $3 million in cash was dropped to the pirates from an aircraft. It was the highest-ever ransom paid, at the time.

Then, about a year later, pirates hijacked the New Orleans-bound tanker Maran Centaurus, which was carrying 2 million barrels -- $150 million worth -- owned by Valero Energy (VLO). In January, a ransom estimated to have been between $5.5 and $7 million dollars was paid, again, dropped by parachute from a helicopter.

Pirates know that the value of the ship and its cargo are usually worth far more than their ransom demand, and a few million dollars is a drop in the bucket (barrel?) in relative terms.

So, how does it work?

Let’s say you own a tanker or the cargo it’s carrying. In the event of a pirate attack, the vessel’s crew contacts company headquarters, which in turn, contacts its insurance company, which in turn, contacts a security firm like London’s Control Risks, which begins negotiations with the hijackers.

"Paying ransoms is not illegal," Guillaume Bonnissent, a special risks underwriter for Hiscox Insurance Co. Ltd, which writes about two-thirds of the world's kidnap-and-ransom insurance policies, told Time magazine. It is, however, illegal for insurance companies themselves to pay ransoms, which is why Control Risks and others make the payments. "K&R is really reimbursement," Bonnissent said. "We reimburse clients for ransoms paid."

"The money is concealed in large floating plastic containers, and flown by air and dropped," says Mike Regester, an insurance broker for Cooper Gay. "Then the pirates go out and pick it up," he says.

As the pirates know ships are generally required to carry K&R coverage for navigating through Somali waters, they know they'll be paid -- unless they're caught first by the international naval fleet protecting the shipping lanes. But last year, 68 successful hijackings were carried out in 200 attacks, netting total ransoms believed to exceed $50 million.

Somali pirate hijackings are financed by what may well be the world’s most unusual “stock market.”

A pirate named “Mohammed” said that, in Haradheere, 250 miles northeast of Mogadishu, brigands set up an exchange of sorts to fund their activities.

"Four months ago, during the monsoon rains, we decided to set up this stock exchange. We started with 15 'maritime companies' and now we are hosting 72. Ten of them have so far been successful at hijacking.”

He explained that, "The shares are open to all and everybody can take part, whether personally at sea or on land by providing cash, weapons or useful materials."

After a ransom payout for releasing a Spanish vessel, “investor” Sahra Ibrahim, was lined up outside the exchange waiting for her cut.

"I am waiting for my share after I contributed a rocket-propelled grenade for the operation," she said.

"I am really happy and lucky. I have made $75,000 in only 38 days since I joined the 'company.'"

Saturday, August 7, 2010

Too Crowded With Bulls.


Judging by some analysts comments, the bullish talking-heads on CNBC, and fearless bulls, we have to continue to question whether this is a "corrective" rally up in the markets working off oversold indicators and sentiment in late June, or the start of a major third Elliott wave structure off the 2009 bottoms that takes the markets to new all-time highs.

In the interim, evidence mounts that the bull trade is getting pretty crowded now just 30-odd days since there were nothing but bears on CNBC and headlines were pretty negative. I scan CNBC here and there, mostly to see how many talking-heads and pundits are bearish versus bullish. Near the July 1 lows, there were all kinds of calls to raise cash and for markets to move much lower, indicating a bottom was probably nigh. Now, nobody is willing to be bearish after this rally, indicating a near-term top is nigh as well.

The Elliott wave patterns still appear to be an intermediate upward correction or a Wave 2 or Wave B up in sentiment off the 1,011 S&P 500 Index lows on July 1. Often bottoms come out of nowhere, as do tops. They don't tend to ring bells at either bottoms or tops, do they? I don't remember getting a phone call on July 1, but I did indicate a pivot low around 1,008 on the S&P 500 would be normal. What I didn't fathom was the extent of the rise since that low, and this has forced me to go back and re-draw charts and find my old Fibonacci calculator.

Right now, the area between 1,131 and 1,140 on the S&P 500 fits several Fibonacci upward targets over various time zones. In addition, the current pattern looks and walks not like a duck, but like an "ending diagonal" triangle. These are terminal patterns and serve to stop sentiment in its tracks when read correctly.I remenbered our KLCI was having the similar patterm in 1996.

Will we have a terminal top or a throw-over top in the next few days on this rally followed by a substantial correction? The probabilities say it’s likely, and above is a chart showing a sample of an "ending diagonal" pattern, and then the actual S&P 500 pattern right now. They look nearly the same. We'll soon see if this "3-3-5" corrective pattern was the right read I made, or if we're off to the races. Evidence suggests a lot of racing from here will be difficult for the bulls to pull off, but we shall see. The lows at 1,011 in terms of the pattern itself just don't seem that they completed to me, hence my stubborn views that we need a re-test of those lows. Time will tell. Sometimes forecasting is like predicting the weather three days in advance -- we'll have to see how the radar is tuned in shortly.

Saturday, July 31, 2010

3 Reasons For Silver.


Although gold continues to grab most of the attention in the precious metal world, its less glamorous sister, silver, may be more appealing, and for good reason.

First off, silver has many more uses than gold. It's used for numerous industrial purposes and nearly 55% of total silver fabrication is used for industrial purposes. Silver is commonly used in the electronics space and can be found in plasma display panels and printed circuit boards, as well as in the lining of refrigerators, for food storage containers, and for water purification. Additionally, the metal can be used as an antimicrobial to fight bacteria and as an antiseptic to treat fungal infections. Silver’s industrial uses even span to the solar energy industry. As economies around the world continue to expand, the industrial demand for silver will likely follow.

Another force that's likely to support silver is that valuations appear to be strong. In a nutshell, silver is cheap and depressed on a historical basis, when compared to its sister metal, gold. Gold is trading much higher than its long-term ratio of 16 times the price of silver, indicating that there's plenty of room for silver prices to run. Additionally, silver is nearly 70% below its all-time high witnessed in 1980 and well below its near-term high of $21 per ounce seen in 2008.

Lastly, diminishing supply is likely to bolster the metal. According to a study conducted by the United States Geological Survey, silver is nearly twice as rare as gold in the long term because it's not recycled at the same rates as gold and at current consumption rates all of the silver that's in the Earth’s crust will diminish away in the next 25 years.

When investing Silver ETFs, it's important to consider factors that could potentially hinder the price of silver like an unexpected surge in the dollar. A good to way to protect against these factors, as well as against the inherent risks involved with investing in equities, is through the use and implementation of an exit strategy that triggers price points at which an upward trend in gold could potentially be coming to an end.

Thursday, July 1, 2010

Talking About S&P 840.


With the magical 1040 level being tested in the S&P 500, many technicians and talking heads are looking at this level as the final step before Armageddon. Running through the various newsletters and blogs, a common theme seems to be that if 1040 doesn't hold, then the 960 level is the last stand before traders get a one-way ticket to test the March 2009 lows of 666. From that point, it's death and destruction to the American economic system as we know it, or so the naysayers would have you believe.

From my perch,I agree that 1040 holds a lot of psychological weight. If a break of this level holds, it should turn many market participants fully bearish and cause a downward cascade that will be difficult to stop. The proverbial line in the sand has been drawn,and the S&P is clawing and scraping at this very moment to remain with its head above this low water mark.

Trying to stay two steps ahead of the action, I roll out the weekly charts to anticipate the next areas of support. I've marked several areas on the weekly chart above that have been battlegrounds in the past. No, these aren't Fibonacci retracements but merely areas where the action stalled as traders, investors, and mutual funds jockeyed for position.

While I've included all of the usual suspects on the weekly chart, it's my belief that the 840 area is often overlooked by the majority of market participants as a battleground. In fact, just looking at the weekly chart, there's not enough information to even cause a trader to pause and consider that level. So let’s roll into the daily charts of that time period and see what we can make of this potential support.

On the daily chart of September 2008 through July 2009. All congestion are right around the 840 level. The truly interesting aspect of this to me is that 840 didn't offer a crisp “one and done” reversal point but instead found itself in the middle of the action for weeks upon weeks. Throughout October 2008, 840 was hit and held several days. Of course, as is the case at the start of any new support levels, there was no way for a trader to even begin to imagine the significance of this level. And even as 2008 came to a close, 840 was bantered around on both sides but was only just beginning to firm up as a key level.

The first two months of 2009 would have been the first time traders might have taken note of how much air time 840 was receiving. Prices seemed to be drawn back to this area like sheet metal to a magnet. When selling pressure resumed and the S&P hit its eventual bottom at 666, 840 was the last area of consolidation. In textbook fashion, 840 once again was an area of consternation and tight play as the S&P bounced off the lows. From there, there was no turning back as the S&P raced to 1200.

Now turn your eyes back to the weekly chart for a bigger-picture view. 840 and 960 may never come into play as the markets could catch a second wind and be off like a racehorse. But if 1040 does relinquish control to the bears, then all eyes will be fixated on the next levels of support. It's my opinion that 840 should be added to the discussion, and that 666 isn't inevitable as we struggle for footing. 960 to 666 is a long step off the end of the plank, but my bet is on 840 being a safety net. So yes, I’d be a buyer of the S&P… at 840.