Wednesday, March 25, 2009

Pursued By The Bulls, Or... Just "Full Of Bull..!"


The S&P bottomed on March 6 at 667. March 6 is 90 degrees, or “squares” the price of 667. 803 vibrates directly off March 6 (it's also a conjunct March 6).

In other words, the date of the significant low resonates on the price of 803 S&P. That time and price square out is a place to look for the first meaningful pullback.

As long as the S&P remains above 780, there remains a chance for a move back to 800 and the weekly close above the 50-dma. The bulls would like to score.

The advance off the November 20 low was 203 points over 6 weeks. 203 points on top of the 667 low from March 6th gives 870 which is near the monthly swing high of 875. The primary target of 720 degrees up from low is 890. 540 degrees up from the March 6th low sets up as 830 S&P. That's the current focus.

If the index recaptures 830 this month with momentum, there's a chance the Monthly Swing Chart may turn up before the end of March. But it appears the greater likelihood will be that the Monthly Swing Chart turns up on trade above whatever the March high is in the first days of April. The strength of lack thereof at that point will be important to observe.

Tuesday, March 24, 2009

Pushing Throught The Limit !


Above is the S&P 500 in relation to Fibonacci retracement levels. Monday's bounce is coming off the first retracement level, which is a sign of incredible strength.
After all, it seems to be on track for the fifth 90% upside day since March 10. (The number of times it's happened before? Zero.)
Like everyone else, I'm watching for last week's highs to be taken out on this second try. If so, the level that will attract attention is in the vicinity of 870.
My main concern for imminent trading action is the level of overbought conditions that we're witnessing on Monday (I didn't think I'd be talking about overbought conditions in a bear market, but nothing in this market is strange).
Some of the overbought conditions surely found temporary relief after Friday's decline, but one of them -- the S&P 500 Short Range Oscillator -- stands at an overbought 7.3. (For perspective, the highest level witnessed since the start of the bear market was +8 on January 8, 2008.)
So, while the market is definitely strong internally, we might be pushing it -- to the limit -- in the short term.

Sunday, March 22, 2009

Velocity Of Money Has Slowed To A Crawl.


With the Federal Reserve seemingly hell-bent on inflating its way out of this recession -- pumping an additional $1 trillion into the market -- the specter of hyperinflation necessarily looms large.

But not so fast: While the Fed’s announcement might seem alarming, Chairman Ben Bernanke is fighting a forest fire with a water weenie.

Back in reality, the ongoing debt destruction and shift back toward savings is having a far greater effect on the American economy than a paltry few hundred billion dollars of “liquidity.” The Wall Street Journal reports that: ".. although M2 money supply has increased 10% in the past year, the cash isn’t really going anywhere."

The more significant number -- what’s known as the “velocity of money” -- fell to its lowest level since 1991. The velocity of money simply means how quickly money is spent: It measures the amount of gross domestic product, or GDP, generated for each dollar of cash sloshing around the system.

When confidence is high, credit is loose, and spenders are running rampant, money flows quickly through the system, boosting GDP. When social mood turns, however, and savers hoard their cash, the velocity of money slows down - and GDP grinds to a halt.

So even though the Fed is injecting more money into the system, consumers are socking it all away in savings accounts or paying down debt. Banks, for their part, aren't doing anything with the money, either. Big banks like Citigroup, Bank of America and JPMorgan Chase, still reeling from mounting losses on bad debt, are horMaybe - all in due time. ding what little cash they have.

Until the bad debt can be destroyed -- and until savers can receive attractive returns -- higher prices will remain merely hypothetical. Back to economics 101.

Inflation, like other economic entities, is controlled by supply and demand. The velocity of money is one way to represent the demand for “stuff” - when it goes up, prices tend to follow.

Fears about inflation are based partly on the assumption that, as consumer demand picks back up, empty store shelves and warehouses will create shortages that could lead to rampaging inflation.

Maybe - all in due time.

As the Journal points out, consumers jumping back into the spending game en masse depends on people not only having actual money to spend, but on having the desire to spend it. And while consumption certainly won't stop altogether, this slowdown may be something more than a run-of-the-mill recession: It may be a structural shift away from the consumerist leanings of the past 30 years.

Maybe, instead of stockpiling oil and gold, we should focus on stockpiling cash.

Monday, March 16, 2009

Dail "M" For Momentum.


When the market turns, it turns like a school of fish - all at once. As traders, it's hard for us to take off our trading cap and replace it with a swing hat. But, when time is up on a particular leg, this is the correct posture and attire to adopt.
The important thing to consider when dealing with cycles and liquidation is that the market is in a vacuum and can go vertical once the selling dries up--and when‘time is up.’ When a significant low is in the market typically does not accommodate by pulling back to let the Street in at‘comfortable’ prices once they have identified a low--once a low has been confirmed. There will be a change in character from the backing and filling which will stick out like a sore flag and a red thumb. Typically at that point you must recognize that the market is not going to retest.
It may retest months out--but on a trading basis the train is leaving the station at that point and when it does you must buy at the market. While the correct posture has been to pace limit bids as every time you chased the market it proved the wrong thing to do, there will come a time where the old rules must bend to buying at the market when strength appears. Naturally you must use a stop. But, the pullback won't come and when it does come it will be the pullback that retraces the entire move. You might have all seen this on various time frames. When and if a turning point comes I would expect the DJIA to rally 1000 points within a week or so.
As for all you Gann traders, the market tends to move off the 90 degree or square harmonics of 90 degrees of the 360 degree year. 90 is important on all time frames. For example, earlier in the week I noted that this week was the 90 months or 7 ½ year anniversary of 9/11/2001. The market declined sharply and then the DJIA rallied 1000 points within a week. From Monday's low the DJIA was up 730 points in three days.
The Weekly Swing Chart turned up on Wednesday gave a very quick short lived reflex pullback into Thursday morning. When the S&P exceeded the level of last weeks high (where the weekly swing chart turned up) it gave a bullish signal indicating an extension higher to my projected first resistance at 746 (270 degrees up from low). Our idealized pullback for Thursday morning stopped shy at 714 which was a test of Wednesday's lows.
The S&P closed nicely over 746 at 750.75 which opens up the alternative for an immediate move of 360 degrees up from low or 774. This level coincides with 50% of the swing from the February 9th high of 875 to the 667 low.
A Friday high close for a reversal week may be to enticing for the bulls to let go. And, if the averages can get through the first hour, that may be the agenda. Be that as it may, from one of these levels near 744 or 774 the first sharp break should come.
Typically the first move up off the low to the 20 DMA finds resistance. Thursday night the S&P closed just above its 20 DMA.
However, the market was so compressed that it may not react here. The market broke out again and closed near resistance, but yesterday was the Thursday the week before the rollout of the new front month for the S&P futures - and a lot of short baskets may be trapped.
The shorts may be on the ropes - but“I would NOT fade the strength and get cute.”
I get a smile on my face when I see so many technicians on the tube. The garden-variety random walkers are gravitating towards the primrose path of technicals. You don'tt need a weatherman to tell you which way the wind blows, Bob Dylan.
Cycles are psychological in nature and imbedded in the spiritus mundi - the web of mass subconscious. The news breaks with the cycles, not the other way around.
The market has responded well to the anniversary of the early March 2003 kickoff, as it tagged a monthly trend line from 1982 (shown recently). The real test will come when the Monthly Swing Chart turns up

Saturday, March 7, 2009

Blondie Infused Jim Morrison. - Awesome!

'>http://

Just WhenYou Think It's Over..


I've read some things written by gold bears of late, calling for gold to decline in March due to “seasonal tendencies."
As always with statistics, if one doesn't know why a particular statistical pattern occurs, one can make incorrect assumptions about future behavior.
In gold's case, it's typical seasonality tends to see gold rally in the fall, and then peak in the early spring. But the reason that we typically see this pattern, is due to the seasonality of gold demand coming from the largest gold jewelry consumer on the planet, whose various festivals revolve around gold: India and Saudi Arabia.
However, jewelry demand is not what is currently driving the gold price. Indian gold imports in February were virtually 0. Meanwhile, gold rallied $100 during February to $1000 and an 11-month high. As always occurs during a big bull market in gold, investment demand is the primary driver of the gold market, and it displaces jewelry demand. And investment demand is obviously not seasonal.
Thus, those expecting gold to follow the usual seasonal patterns may be in for a surprise. As I discussed in Countdown to the Gold Rally, the $100 decline from gold's peak of 10 days ago, was driven by an unusually high amount of short selling. I suspect this was based on the premise that the decline in Indian demand in February (and the "seasonal pattern") were predicting gold demand would wane, and lead to a decline.
If I'm correct, however, in my belief that investment demand is now the primary driver of the gold price (and not jewelry demand), then the gold market is set up for a vicious short squeeze. That squeeze could be augmented even further if the dollar declines sharply in the next few weeks, which gold -- as well as silver, platinum, and many other commodities -- appears to have been anticipating all along, with its rally since mid-December 2008 in the face of a rising dollar.
Meanwhile, the gold shorts continued to add to levered positions in the 2-times short gold ETFs this week - which short the COMEX futures to keep up their levered exposure. The shares outstanding of both ETFs below, which have exploded over the past few weeks as more and more bears have piled into these 2-times short ETFs, and pushed up COMEX gold open interest over the past 10 days - even as the price has declined.
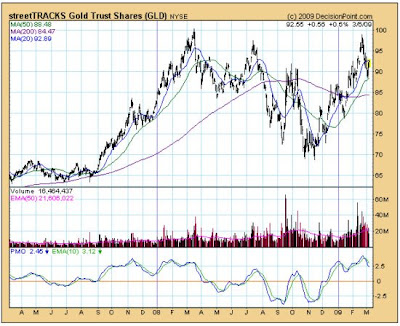
Nevertheless, the GLD gold ETF (whose 150 tonnes of gold demand in February played a big role in pushing the gold price higher), hasn't seen its shares outstanding, fall by a single share. This means it hasn't sold a single ounce of gold since that $1000 peak in late February, either. Thus, anyone believing that the recent February rally in gold and the demand for the ETF was "retail" -- or merely, “fast money”-- has to seriously question that belief. The action in GLD thus far is, in fact, the classic definition of “strong hands” that don't react to price weakness by selling.
With gold having finally turned up yesterday -- and having added to those gains again today following the prior 8 straight days of heavy selling by shorts -- my bet is that the gold bears may be in for a big surprise, ishyak allah... But as always, we shall see.

"Ketuanan?" - My Two Balls ! Celaka!


Pre-Angkor temple civilization found in Malaysia may be oldest in region Malaysia SunFriday 6th March, 2009

Kuala Lumpur, March 6 : Archaeologists in Malaysia have discovered the main site of an ancient kingdom that predates the Angkor temples of Cambodia and could be the oldest civilization in the region.

According to a report in Taipei Times, archeological team leader professor Mokhtar Saidin said the find, which could lead to a rewriting of history books on the region, was made in two palm oil plantations in northern Kedah State last month.

He said that buildings found at the site indicate it was part of the ancient Hindu kingdom of Bujang which existed in the area some time in the third century, predating the Angkor civilization of Cambodia which flourished from the 12th to 14th centuries."

We have dated artifacts from what we believe are an administration building and an iron smelter to 1,700 BP (250AD), which sets the Bujang civilization between the third and fourth century AD," Saidin said. "We have only one date so far so we can say it is one of the earliest civilizations in the region, but with more dates, we will be able to verify whether it is the oldest civilization in the region," he added. Mokhtar said the iron smelter was a surprise find as it showed that such an early civilization was already quite advanced technologically."We have 30 more mounds at the site that have to be excavated and we are hoping to also find the port area for the kingdom as it was near the sea," he said. "This will give us a clue to how the civilization was trading and influenced by China and India, who would have been the two main powers back then to have influenced development in this region," he added.

Malaysian archeologists last month also announced the discovery of stone tools they believe are more than 1.8 million years old and the earliest evidence of human ancestors in Southeast Asia.

The stone hand-axes were discovered last year in the historical site of Lenggong in northern Perak State, embedded in a type of rock formed by meteorites.

Thursday, March 5, 2009

On Backwardation In The VIX.


Lots of buzz about the large backwardation in the VIX. The "spot" VIX was over 51 at the time; the March VIX future was roughly a 47, July roughly 43.
Now, of course, it's an accurate point. That's the "spot" VIX premium, and it's on the high end.
But here's the rub: It doesn't mean a whole lot beyond what we already know.
The VIX tends to "mean revert." Shorter-term moves one way tend to reverse course and return to some perceived mean. The best definitions of a "mean" are longer-dated volatility measures - or perhaps a moving average of shorter-term measures.
The longer the duration, the less noise, and the more it resembles lasting volatility assumptions. So logically, the shorter-term measure should "revert" to the longer term one.
VIX futures are not volatility estimates, per se. They're estimates of where the VIX will be on a given date. So as a "mean" estimator, they do fine.
So, what's the problem with this analysis?
Two things: One, there's no magical premium of the VIX, beyond a given VIX future, that signals a reversal is particularly imminent. The VIX yesterday at midday was merely 8% above the March future. There's no reason that can't that go to 18%, or even 28%. In fact, the VIX did soar way beyond near-month futures all the way back in October.
Two, a small subset of the time, the VIX itself is the mean, and it's the futures and longer dated options measures (like the VXV, which is the VIX for 90-day options) that move.
Look, I believe the selling in the market is over-extended last week. And I believe that options volatility is too high, based on actual market volatility. So I agree with the premise that the VIX will decline.
But the futures, by definition, are saying the exact same thing. It's just kind of a redundant observation, and not one I would hang my hat on to presage the next rally.

Sunday, March 1, 2009

Standing-By For The Impending Gold Short Squeeze.


Despite Friday's decline in the gold price, SPDR GOLD TRUST ETFs' (GLD) gold holdings rose a third of a tonne to just over 1029 tonnes and another new all-time high.

Friday, COMEX open interest rose by a touch again on Wednesday -- to 373,339 contracts -- despite the sharp decline in the gold price. Which suggests once again that the decline was primarily the result of more heavy short selling by gold bears - and not bulls closing out longs.

In fact, if we look at the rate of growth in the shares outstanding of the 2x short gold ETFs (DZZ and GLL), you can see the rapid increase in the rate of new shorts that's occurred in just these 2 ETFs over the past couple of weeks.

Given that the GLD ETF hasn't sold an ounce during this decline (and actually added a little Friday), this is the setup for a huge short squeeze wherever this 4-day decline in gold terminates. Friday's dip back to what was the October high and the ensuing reversal to end on the highs may just have signaled we've hammered out a low for this decline.